Beschreibung
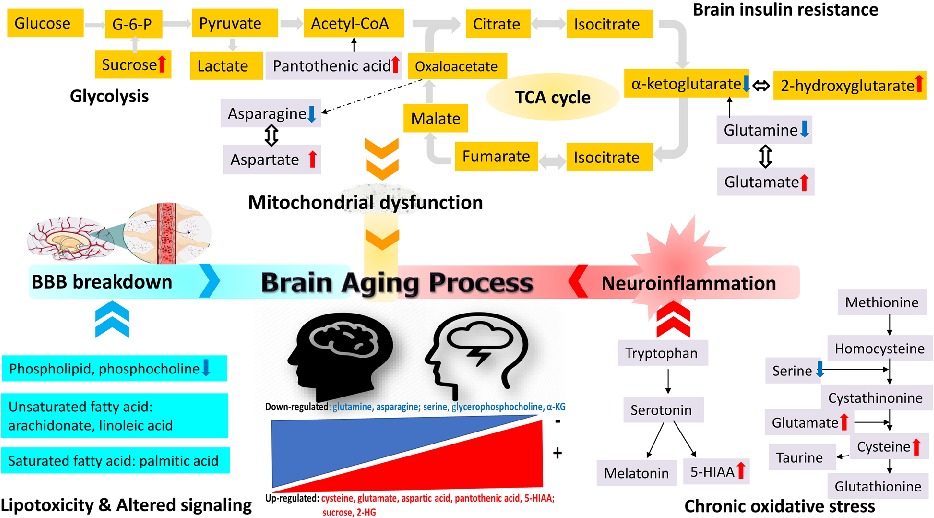
A schematic diagram summarizes the profiled CSF metabolite changes during brain aging, linking age-related metabolic shifts to neurodegeneration risk pathways.
More Figures from This Paper
Figure 6
Scatter plots of individual metabolite abundance versus age reveal significant correlations for specific compounds, suggesting continuous metabolic drift across the lifespan.
chart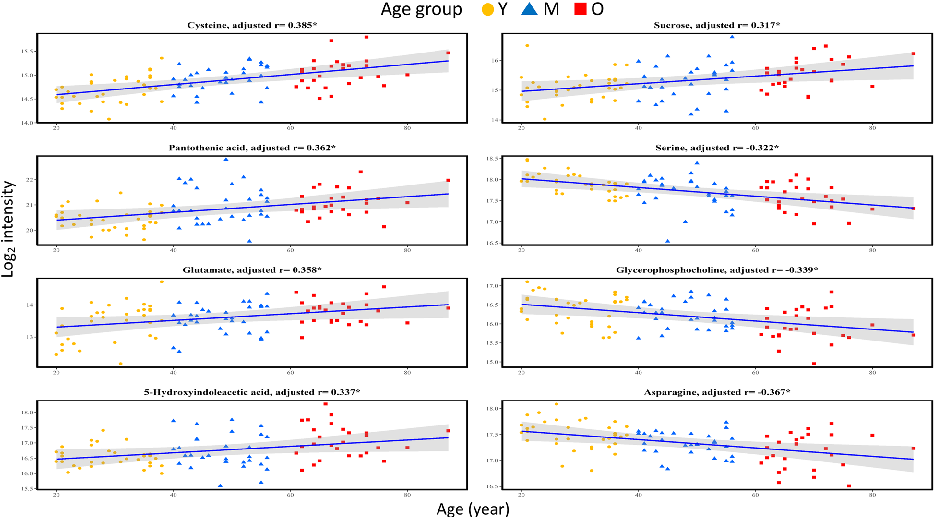
Figure 7
Sex-stratified metabolite-age correlation analysis in cerebrospinal fluid shows both shared and sex-specific metabolic aging patterns.
chart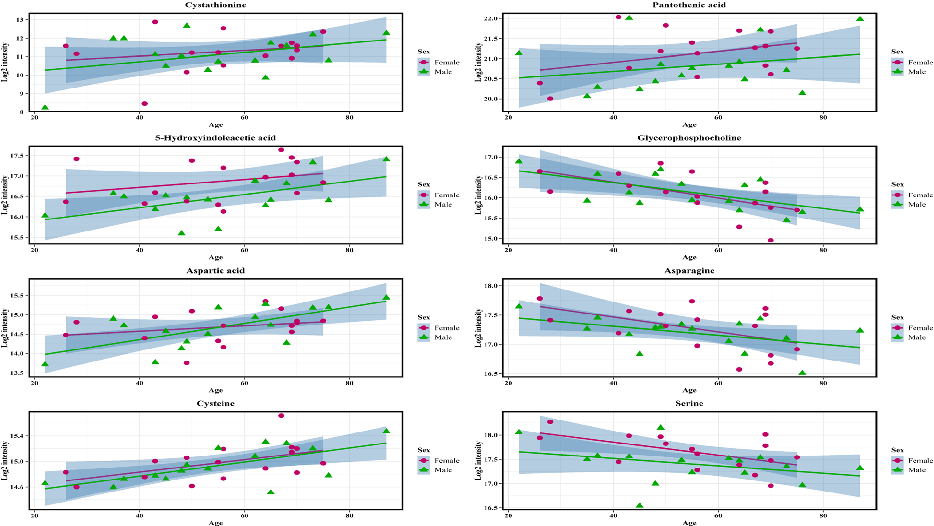
Figure 8
Pathway enrichment analysis of age-associated CSF metabolites identifies disrupted metabolic pathways, including amino acid and lipid metabolism, during brain aging.
chart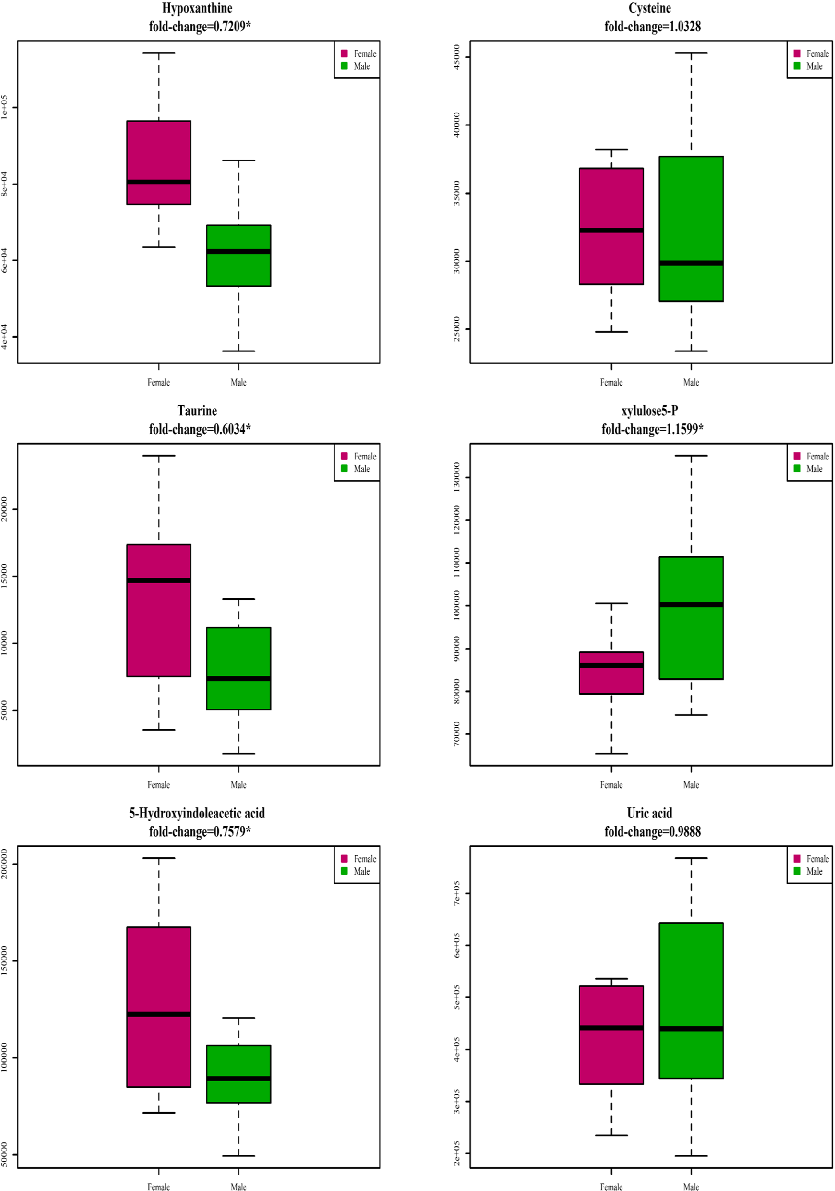
Figure 9
Receiver operating characteristic curves evaluate the discriminative ability of selected CSF metabolites to distinguish older from younger cognitively healthy adults.
chartFigure 10
DiagramSource Paper
Exploring the aging process of cognitively healthy adults by analyzing cerebrospinal fluid metabolomics using liquid chromatography-tandem mass spectrometry.Cite This Figure
 > Source: Fu-Chao Liu et al. "Exploring the aging process of cognitively healthy adults by analyzing cerebrosp." *BMC geriatrics*, 2023. PMID: [37020298](https://pubmed.ncbi.nlm.nih.gov/37020298/)
<figure>
  <img src="https://pdfs.citedhealth.com/figures/37020298/181.png" alt="A schematic diagram summarizes the profiled CSF metabolite changes during brain aging, linking age-related metabolic shifts to neurodegeneration risk pathways." />
  <figcaption>Figure 10. A schematic diagram summarizes the profiled CSF metabolite changes during brain aging, linking age-related metabolic shifts to neurodegeneration risk pathways.<br>  Source: Fu-Chao Liu et al. "Exploring the aging process of cognitively healthy adults by analyzing cerebrosp." <em>BMC geriatrics</em>, 2023. PMID: <a href="https://pubmed.ncbi.nlm.nih.gov/37020298/">37020298</a></figcaption>
</figure>