Phosphatidylserine 図
22 査読済み研究からの図表
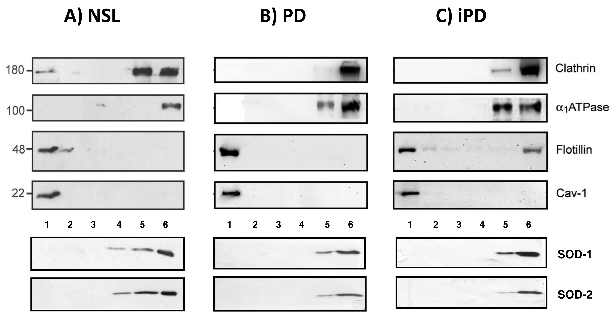
Western blot analyses of protein markers across density gradient fractions from control, Parkinson's disease, and incidental PD brain cortices reveal altered lipid raft protein distribution.
Severe alterations in lipid composition of frontal cortex lipid rafts from Parkinson's …
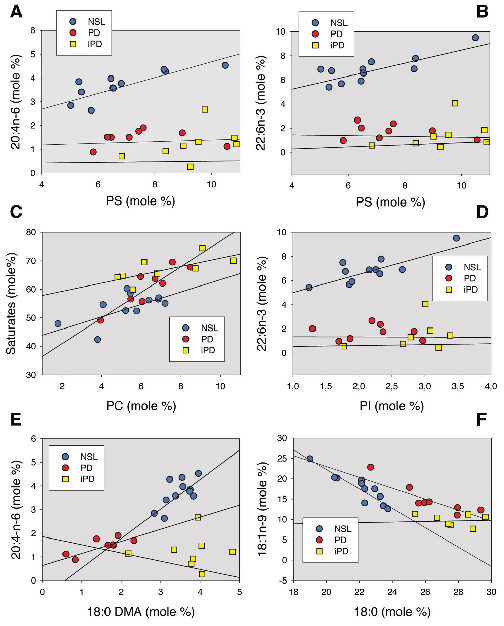
Lipid composition analyses comparing raft and non-raft fractions between control and Parkinson's disease frontal cortex samples show significant alterations in cholesterol and sphingolipid content.
Severe alterations in lipid composition of frontal cortex lipid rafts from Parkinson's …
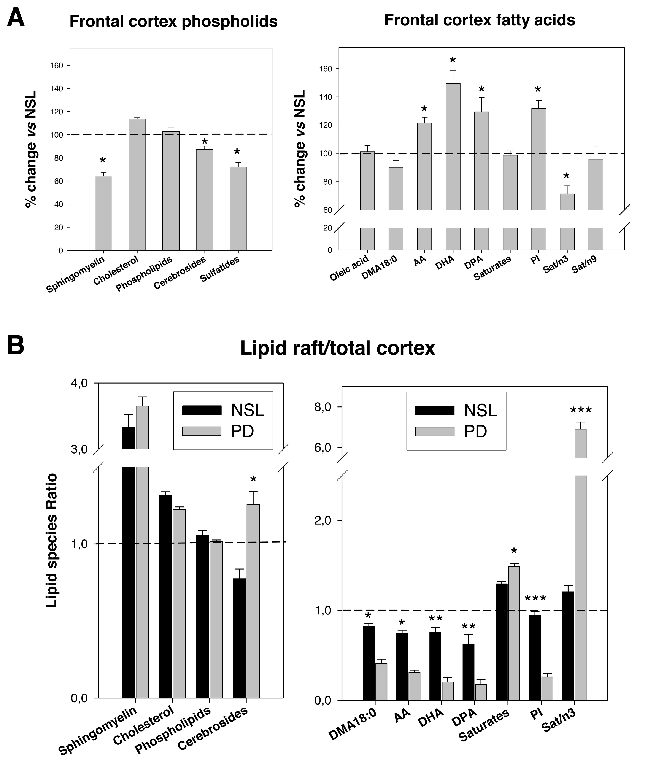
Comparative analyses of main lipid classes and fatty acid content between control and PD frontal cortex gray matter reveal disease-associated shifts in polyunsaturated fatty acid profiles and raft lipid indices.
Severe alterations in lipid composition of frontal cortex lipid rafts from Parkinson's …
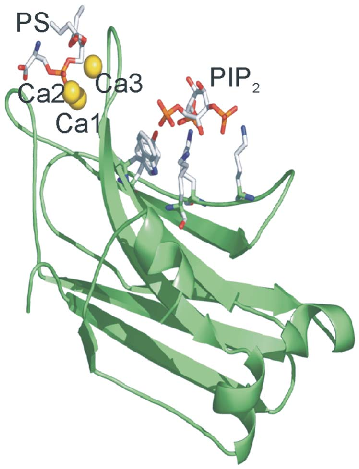
The crystal structure of the PKCα C2 domain bound to calcium, phosphatidylserine, and PIP2 in a quaternary complex is rendered, showing the spatial arrangement of lipid-binding sites.
Phosphatidylinositol 4,5-bisphosphate decreases the concentration of Ca2+, phosphatidylserine and diacylglycerol required for …
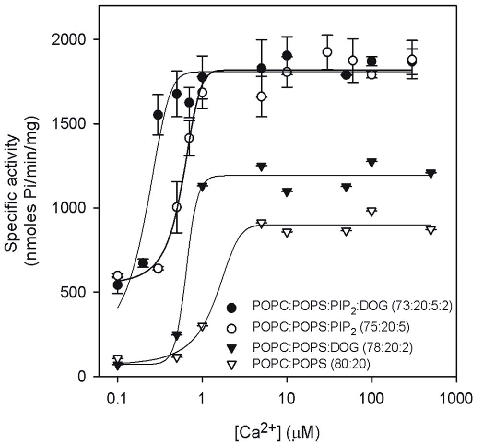
PKCα enzymatic activity is plotted as a function of calcium concentration, demonstrating how PIP2 reduces the calcium requirement for maximal kinase activation.
Phosphatidylinositol 4,5-bisphosphate decreases the concentration of Ca2+, phosphatidylserine and diacylglycerol required for …
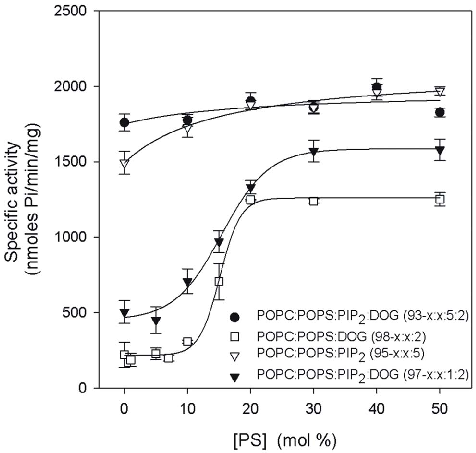
The dependence of PKCα activity on phosphatidylserine (POPS) concentration in lipid vesicles reveals that PIP2 lowers the threshold of phosphatidylserine needed for enzyme activation.
Phosphatidylinositol 4,5-bisphosphate decreases the concentration of Ca2+, phosphatidylserine and diacylglycerol required for …
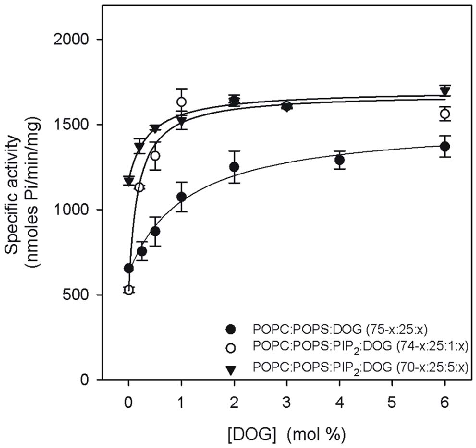
PKCα activity is shown as a function of diacylglycerol (DOG) molar percentage in lipid vesicles, illustrating the cofactor requirements for kinase activation.
Phosphatidylinositol 4,5-bisphosphate decreases the concentration of Ca2+, phosphatidylserine and diacylglycerol required for …
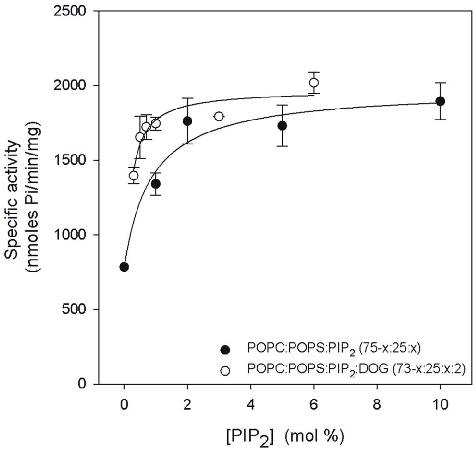
The relationship between PIP2 concentration and PKCα activity demonstrates that increasing PIP2 in lipid vesicles progressively enhances kinase activation efficiency.
Phosphatidylinositol 4,5-bisphosphate decreases the concentration of Ca2+, phosphatidylserine and diacylglycerol required for …
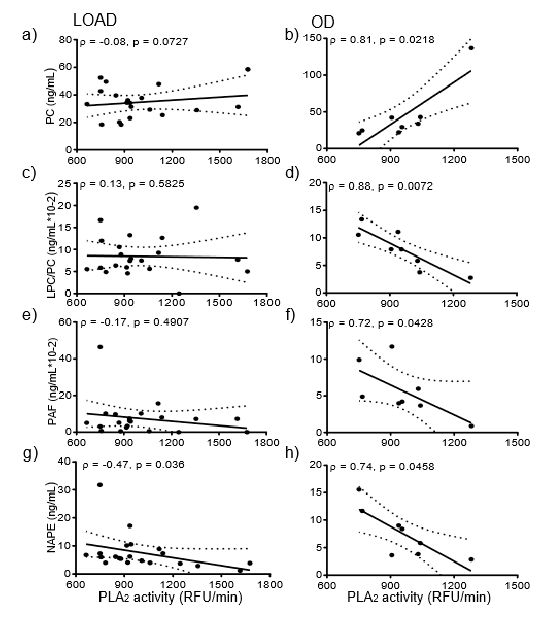
Correlation analysis between PLA2 activity and glycerophospholipid levels in Alzheimer's disease patients reveals no significant association, suggesting independent dysregulation pathways.
Lipid Metabolism in Late-Onset Alzheimer's Disease Differs from Patients Presenting with Other …
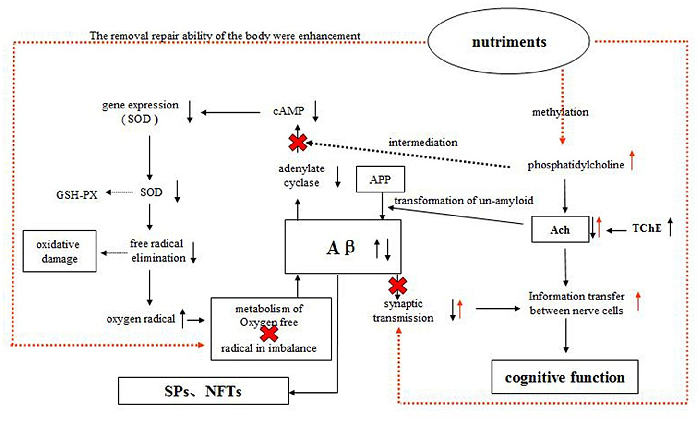
A schematic diagram illustrates the proposed mechanisms by which the compound nutrient mixture may protect against Alzheimer's pathology, including acetylcholine and cAMP signaling.
Protective Effects of Dietary Supplementation with a Combination of Nutrients in a …
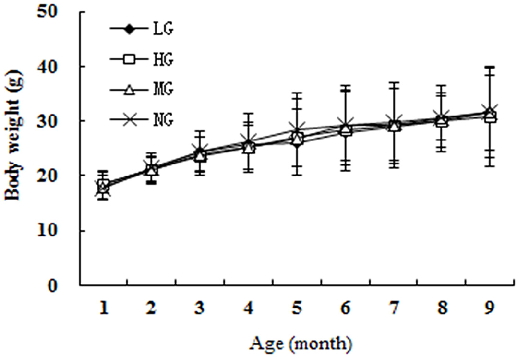
Daily food intake across groups confirms consistent consumption, with no significant differences between the low, high, and model groups during the study.
Protective Effects of Dietary Supplementation with a Combination of Nutrients in a …
Biochemical markers of oxidative stress and antioxidant capacity in brain tissue are compared across treatment groups, showing dose-dependent protective effects.
Protective Effects of Dietary Supplementation with a Combination of Nutrients in a …
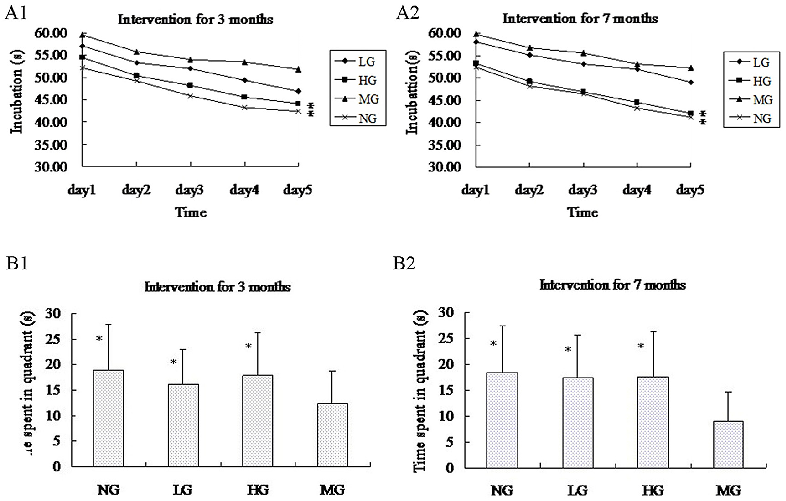
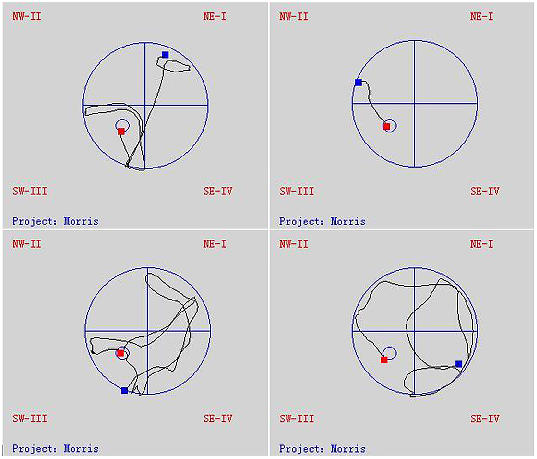
Morris water maze test results reveal that nutrient-supplemented APP-PSN mice demonstrate shorter escape latency and improved spatial memory compared to untreated transgenic controls.
Protective Effects of Dietary Supplementation with a Combination of Nutrients in a …
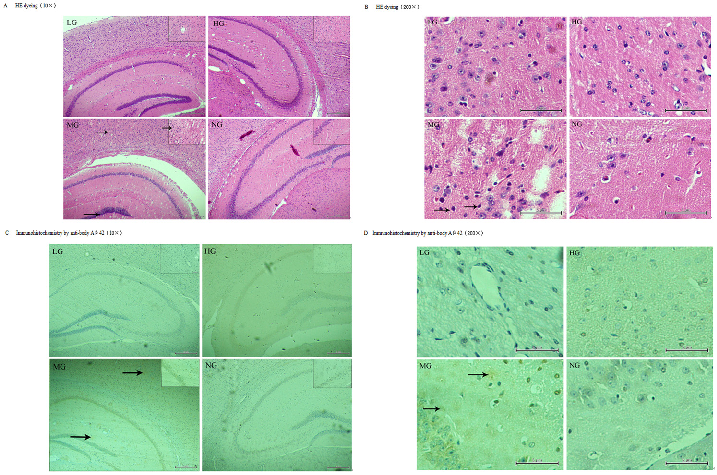
Immunofluorescence staining of amyloid-beta plaques in the temporal cortex and hippocampus shows reduced plaque burden in nutrient-treated APP-PSN transgenic mice.
Protective Effects of Dietary Supplementation with a Combination of Nutrients in a …
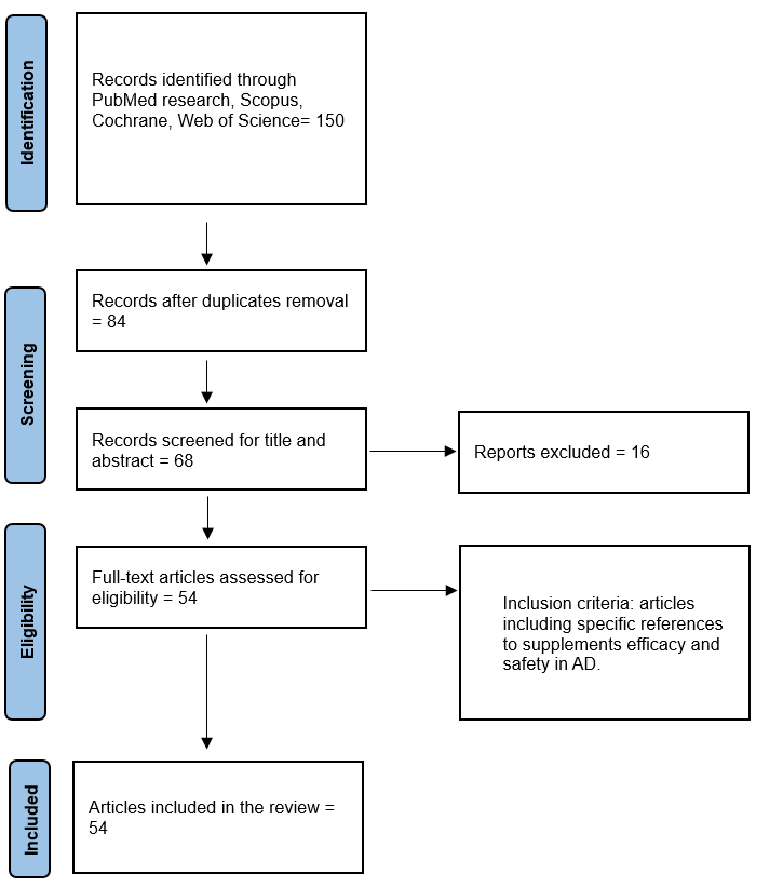
Figure 1. Flow-chart.
Exploring the Efficacy and Safety of Nutritional Supplements in Alzheimer's Disease.
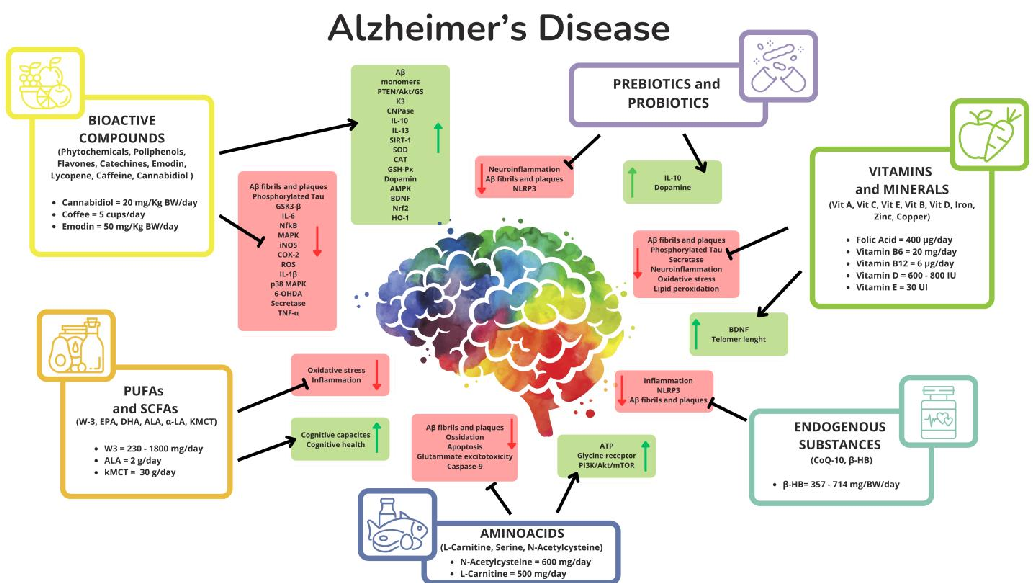
Exploring the Efficacy and Safety of Nutritional Supplements in Alzheimer's Disease.
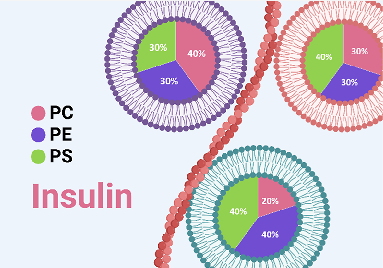
Concentration of Phosphatidylserine Influence Rates of Insulin Aggregation and Toxicity of Amyloid …
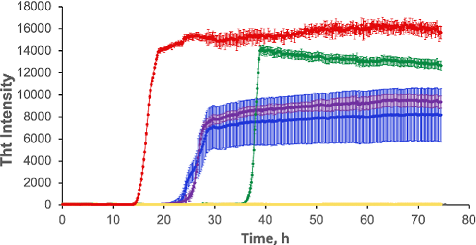
Figure 1. Increase in the concentration of PS in the lipid mixtures increases the aggregation rate of insulin. Averages of triplicates of ThT aggregation kinetics of insulin (Ins) in the …
Concentration of Phosphatidylserine Influence Rates of Insulin Aggregation and Toxicity of Amyloid …
Concentration of Phosphatidylserine Influence Rates of Insulin Aggregation and Toxicity of Amyloid …
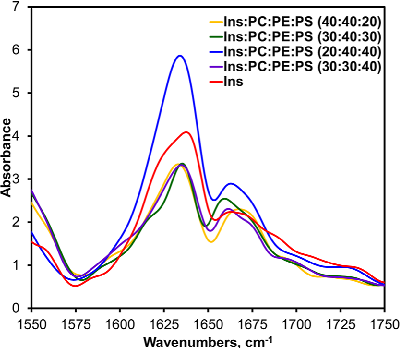
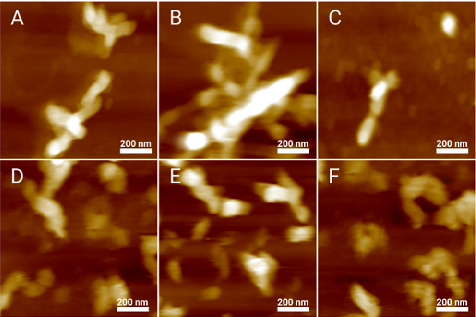
Figure 4. AFM-IR spectra acquired from insulin (Ins) fibrils grown in the lipid-free environment (red), insulin in the presence of LUVs of PC/PE/PS (40:40:20) (yellow), PC/PE/PS (30:40:30) (green), PC/ PE/PS …
Concentration of Phosphatidylserine Influence Rates of Insulin Aggregation and Toxicity of Amyloid …
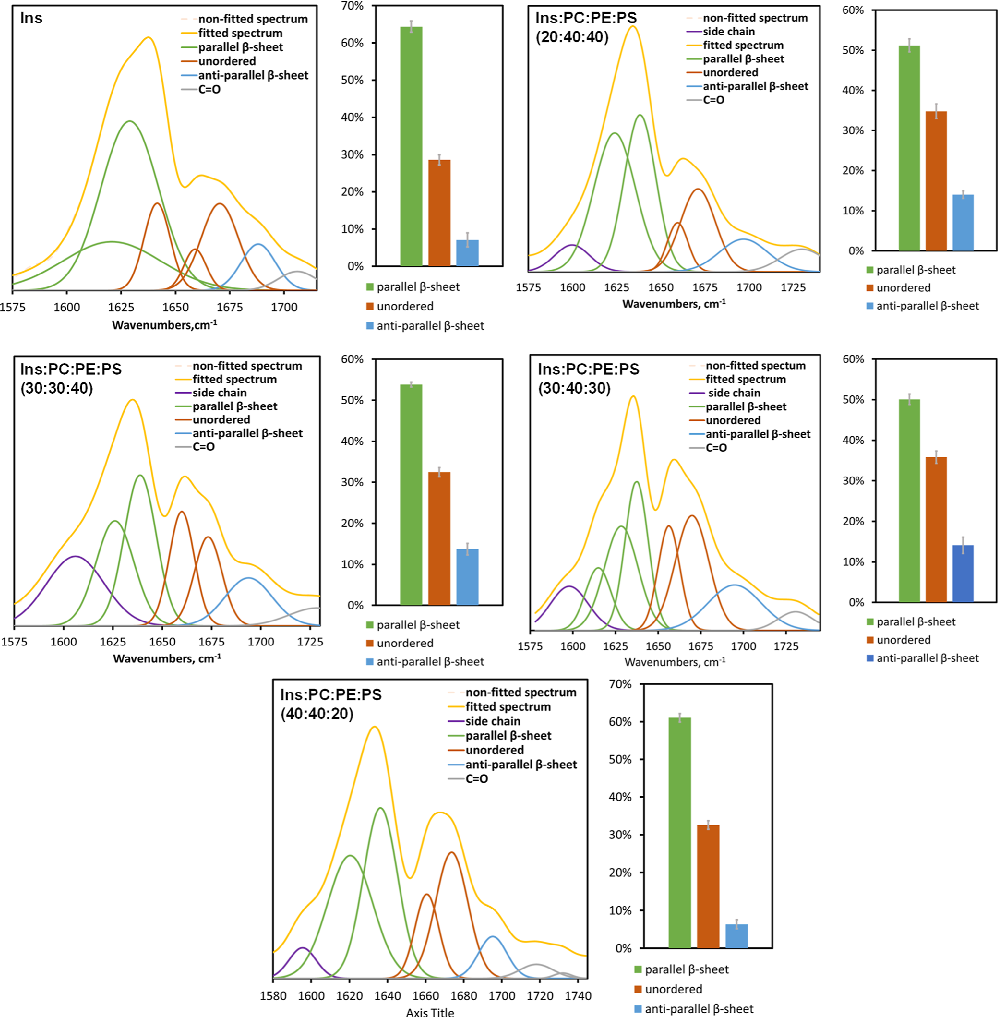
Concentration of Phosphatidylserine Influence Rates of Insulin Aggregation and Toxicity of Amyloid …
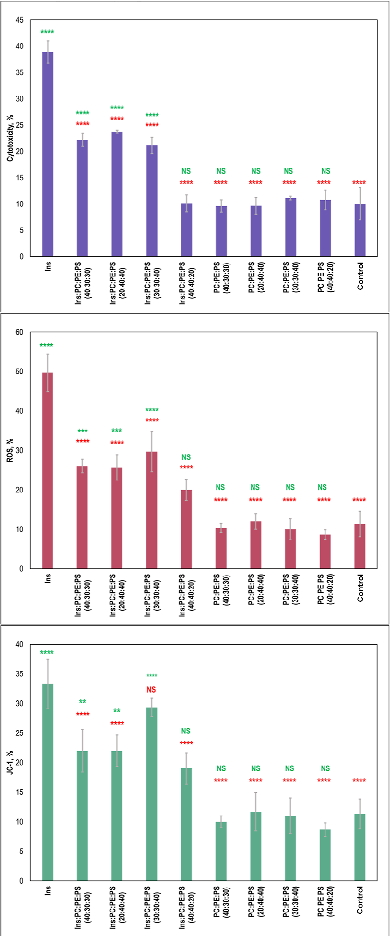
Concentration of Phosphatidylserine Influence Rates of Insulin Aggregation and Toxicity of Amyloid …