Resveratrol Hình ảnh
23 hình ảnh từ nghiên cứu có bình duyệt
Vascular biomarkers and endothelial function parameters were measured to assess resveratrol's cardiovascular effects. This figure presents changes in vascular health indicators during the 14-week supplementation trial.
Effects of Resveratrol on Cognitive Performance, Mood and Cerebrovascular Function in Post-Menopausal …
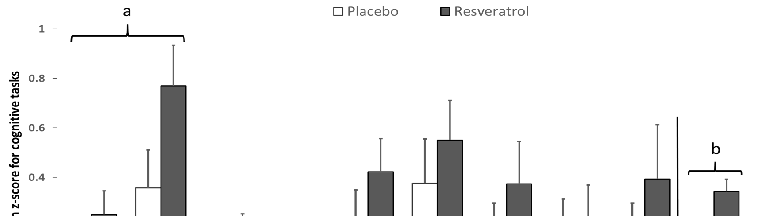
Resveratrol supplementation was associated with changes in cognitive test performance in post-menopausal women. Pre-post intervention differences calculated using Z-scores revealed significant differences between resveratrol and placebo groups on individual cognitive domains and overall cognitive performance.
Effects of Resveratrol on Cognitive Performance, Mood and Cerebrovascular Function in Post-Menopausal …
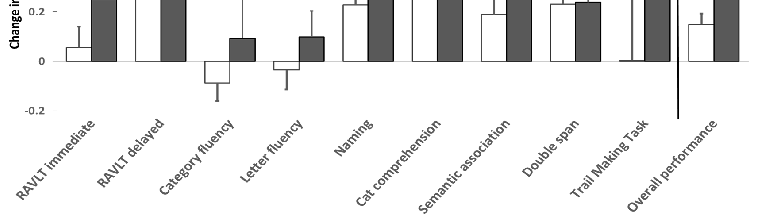
Cerebrovascular responsiveness to hypercapnia was measured in the middle cerebral artery using transcranial Doppler ultrasound. Treatment changes in cerebrovascular reactivity after 14 weeks suggest resveratrol may enhance cerebral blood flow regulation in post-menopausal women.
Effects of Resveratrol on Cognitive Performance, Mood and Cerebrovascular Function in Post-Menopausal …
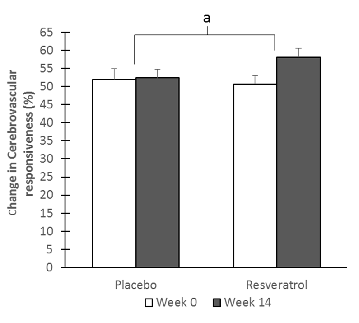
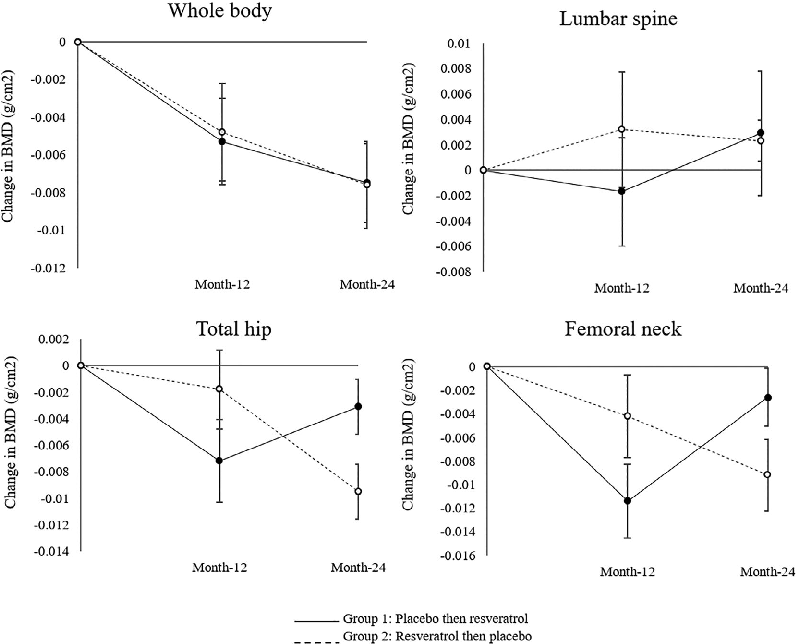
Participant flow or baseline characteristics from a randomized placebo-controlled trial of resveratrol supplementation in postmenopausal women are presented. The study tested whether regular resveratrol intake could improve bone mineral density in women at risk for osteoporosis.
Regular Supplementation With Resveratrol Improves Bone Mineral Density in Postmenopausal Women: A …
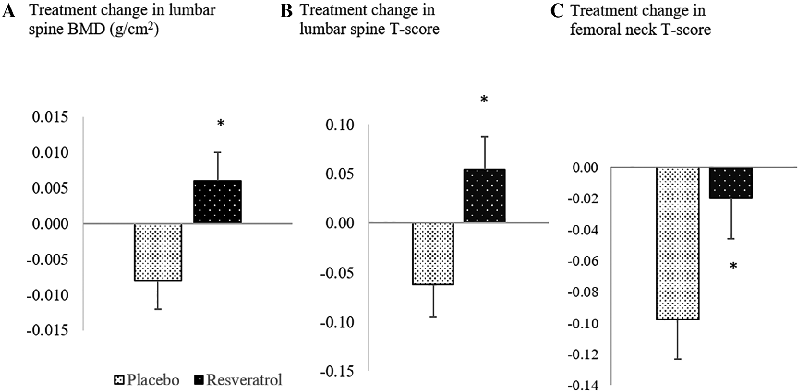
Bone mineral density measurements at key skeletal sites are compared between resveratrol and placebo groups over the trial period. Resveratrol, a polyphenol found in red grapes, was hypothesized to act as a phytoestrogen with bone-protective properties.
Regular Supplementation With Resveratrol Improves Bone Mineral Density in Postmenopausal Women: A …
Secondary outcomes or biomarker data from the resveratrol supplementation trial are displayed. The analysis examines whether improvements in bone mineral density correlate with changes in bone turnover markers or inflammatory mediators.
Regular Supplementation With Resveratrol Improves Bone Mineral Density in Postmenopausal Women: A …
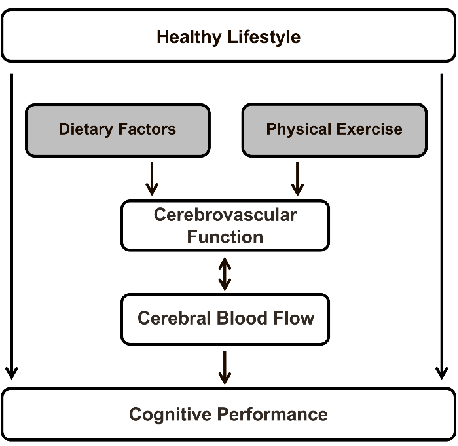
A schematic overview maps the relationships between dietary factors — including nitrate, polyphenols, fatty acids, and caffeine — and their effects on cerebral blood flow, integrating evidence from neuroimaging studies.
Cerebral Blood Flow Measurements in Adults: A Review on the Effects of …
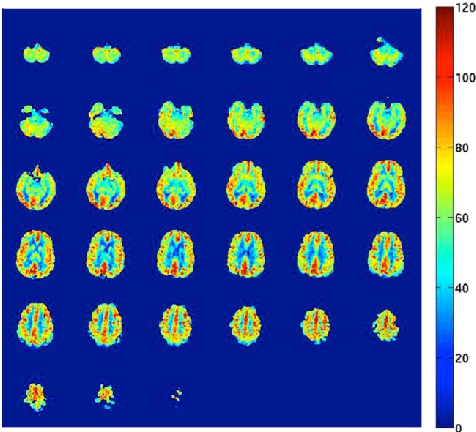
An arterial spin labeling cerebral blood flow map displays regional perfusion in units of milliliters per 100 grams of brain tissue per minute, illustrating the spatial distribution of blood flow across cortical regions.
Cerebral Blood Flow Measurements in Adults: A Review on the Effects of …
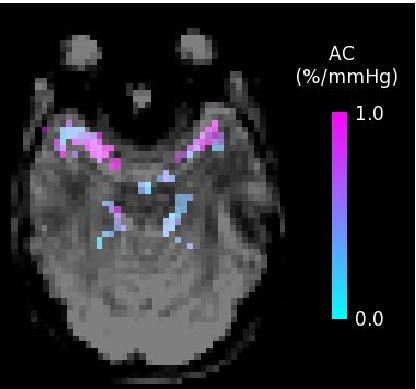
An arterial compliance map shows the percentage change in arterial blood volume per millimeter of mercury, obtained using short inversion time arterial spin labeling to assess cerebrovascular reactivity.
Cerebral Blood Flow Measurements in Adults: A Review on the Effects of …
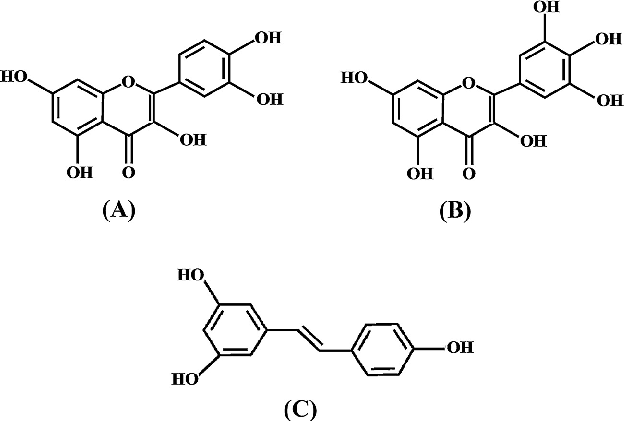
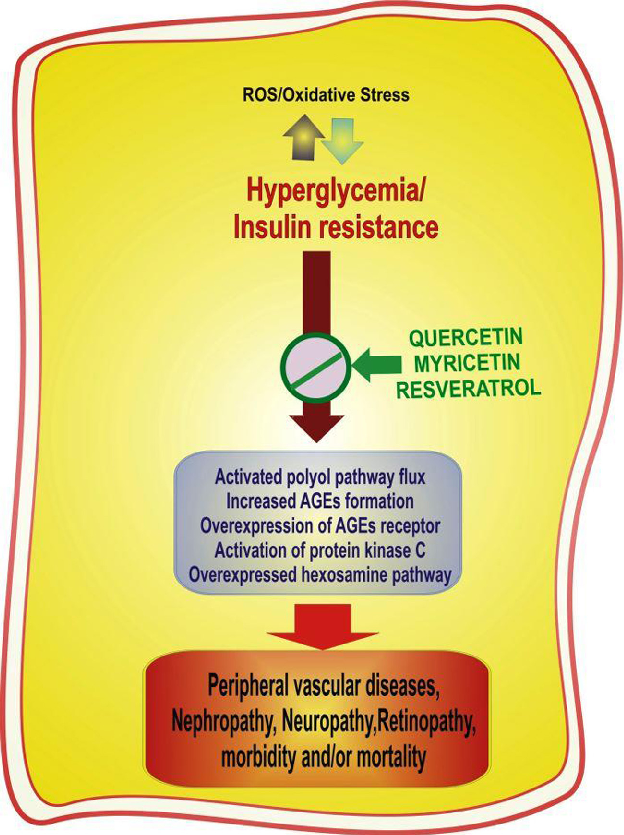
Molecular mechanisms by which red grape polyphenols exert antidiabetic effects are illustrated, including modulation of insulin signaling, glucose uptake, and oxidative stress pathways.
Role of red grape polyphenols as antidiabetic agents.
Preclinical and clinical evidence for red grape polyphenol interventions in diabetes management is reviewed, highlighting effects on glycemic control, insulin sensitivity, and diabetic complications.
Role of red grape polyphenols as antidiabetic agents.
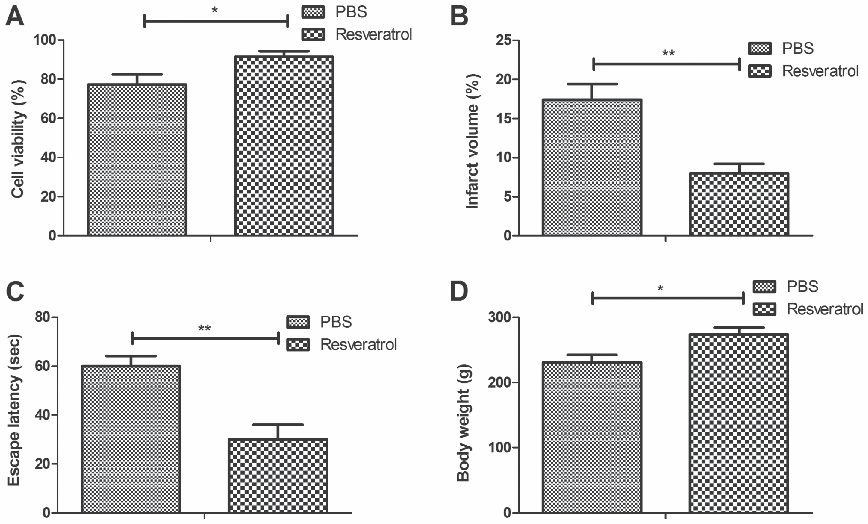
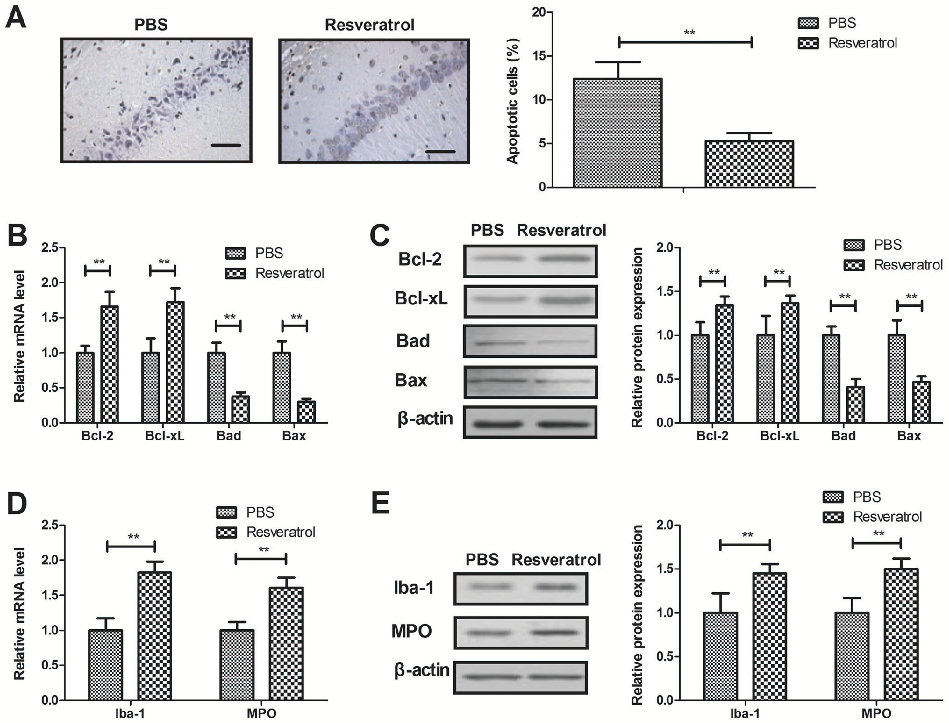
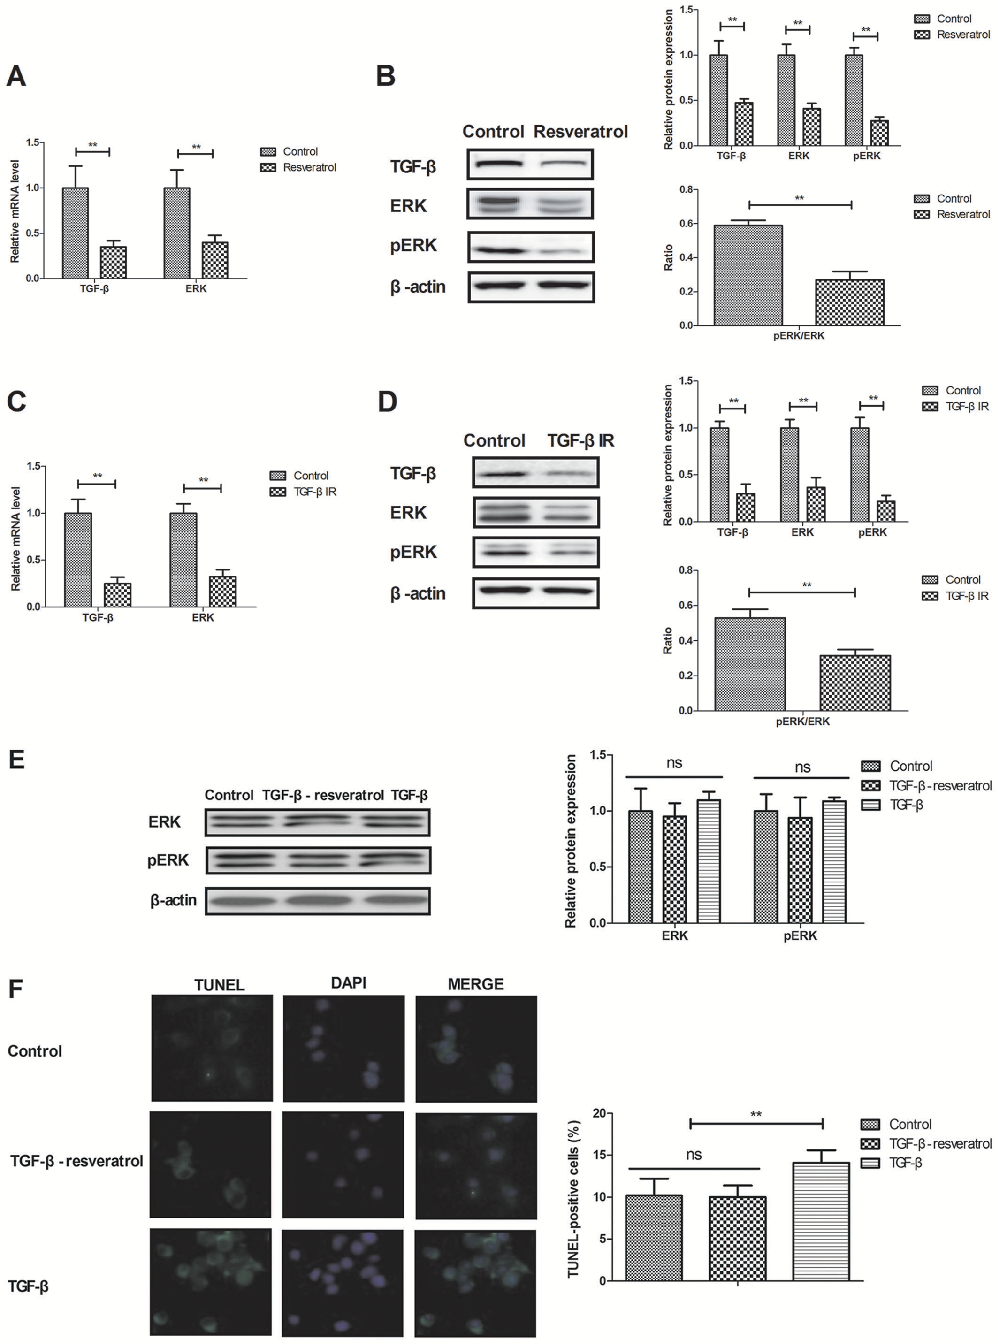
Resveratrol ameliorates brain injury via the TGF-β-mediated ERK signaling pathway in a …
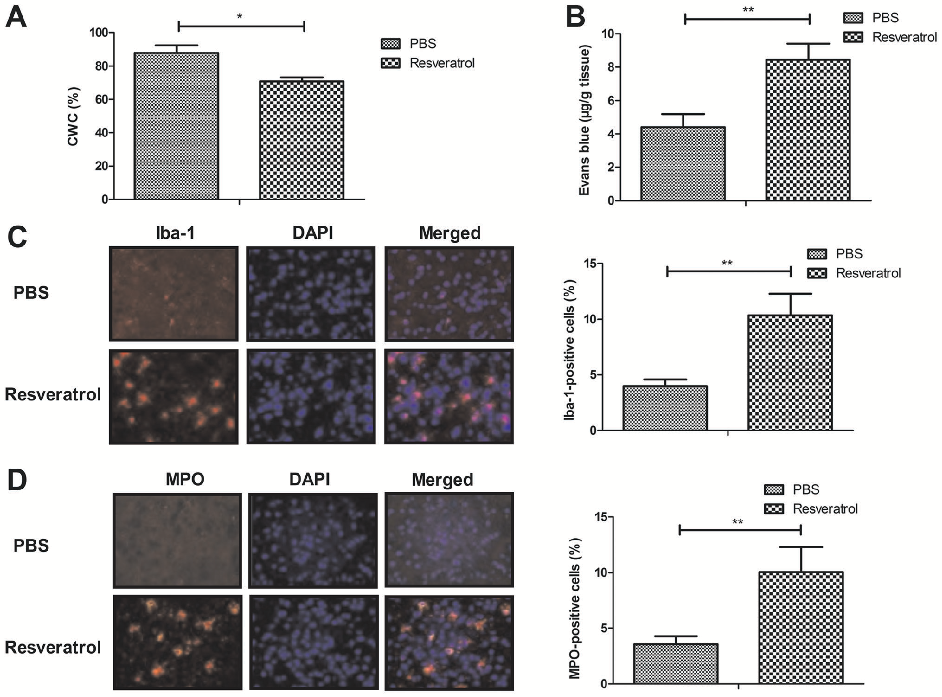
Resveratrol ameliorates brain injury via the TGF-β-mediated ERK signaling pathway in a …
Resveratrol ameliorates brain injury via the TGF-β-mediated ERK signaling pathway in a …
Resveratrol ameliorates brain injury via the TGF-β-mediated ERK signaling pathway in a …
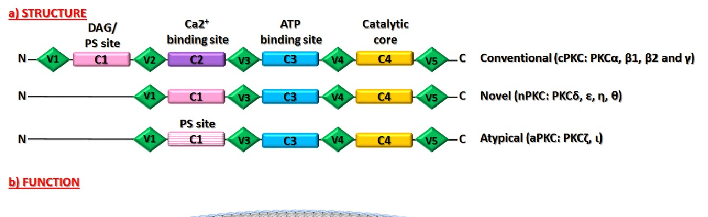
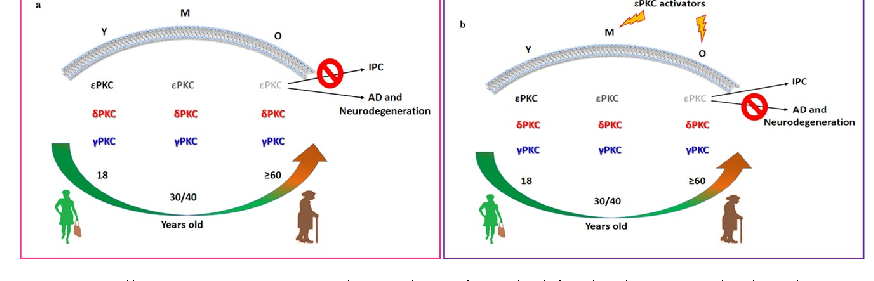
Subcellular distribution of PKC isoforms between cytosolic and membrane fractions is analyzed, showing altered translocation patterns in aged brain tissue.
Age-Dependent Levels of Protein Kinase Cs in Brain: Reduction of Endogenous Mechanisms …
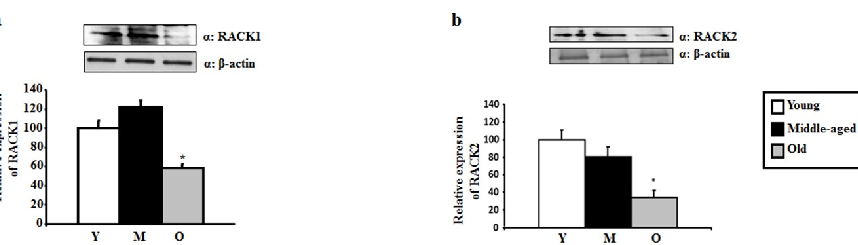
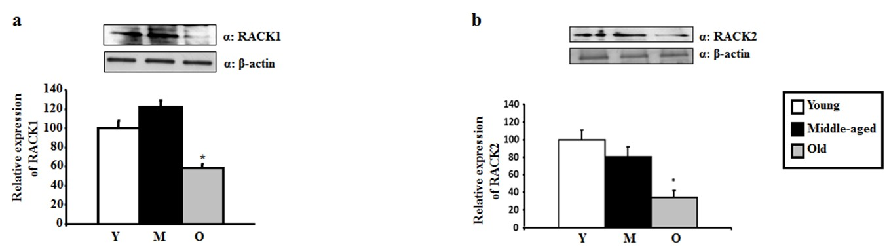
RACK1 and RACK2 scaffolding protein levels are measured in aging hippocampus, indicating reduced anchoring capacity for activated PKC isoforms.
Age-Dependent Levels of Protein Kinase Cs in Brain: Reduction of Endogenous Mechanisms …
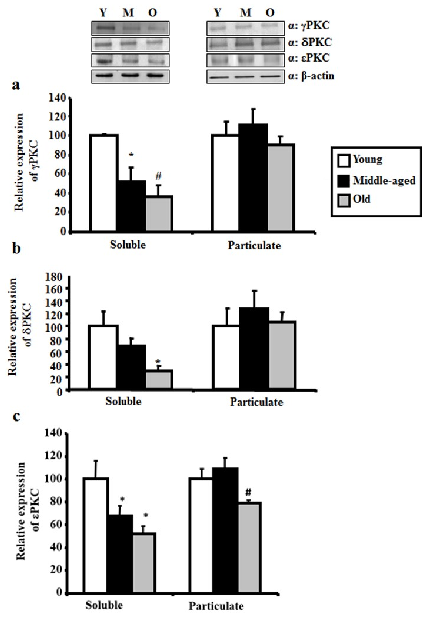
Western blot analysis of gamma, delta, and epsilon PKC levels in hippocampus across young, middle-aged, and aged rats demonstrates progressive age-related reduction.
Age-Dependent Levels of Protein Kinase Cs in Brain: Reduction of Endogenous Mechanisms …
Quantitative densitometry of PKC isoform bands confirms statistically significant declines in neuroprotective PKC levels with advancing age.
Age-Dependent Levels of Protein Kinase Cs in Brain: Reduction of Endogenous Mechanisms …
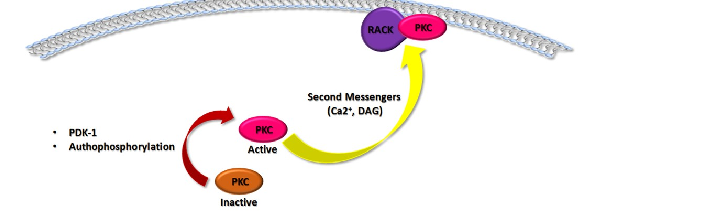
Activated PKC translocation to membrane fractions is diminished in aged rats, with reduced binding to RACK scaffolding proteins contributing to impaired neuroprotective signaling.
Age-Dependent Levels of Protein Kinase Cs in Brain: Reduction of Endogenous Mechanisms …
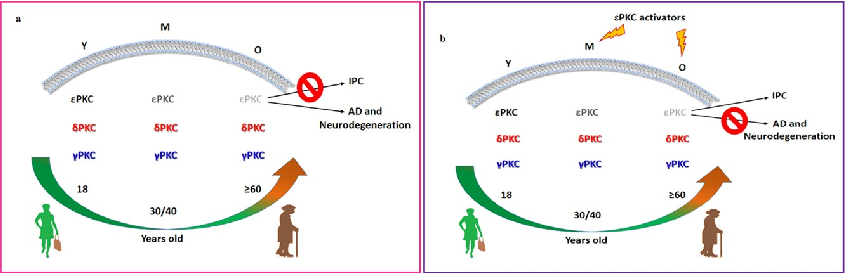
Schematic representation of PKC isoform and RACK protein distribution in membrane fractions of young versus aged rat hippocampus illustrates the age-dependent loss of neuroprotective mechanisms.
Age-Dependent Levels of Protein Kinase Cs in Brain: Reduction of Endogenous Mechanisms …
RACK1 and RACK2 protein levels in hippocampal tissue are quantified by Western blot across three age groups, with both scaffolding proteins showing age-related reductions.
Age-Dependent Levels of Protein Kinase Cs in Brain: Reduction of Endogenous Mechanisms …
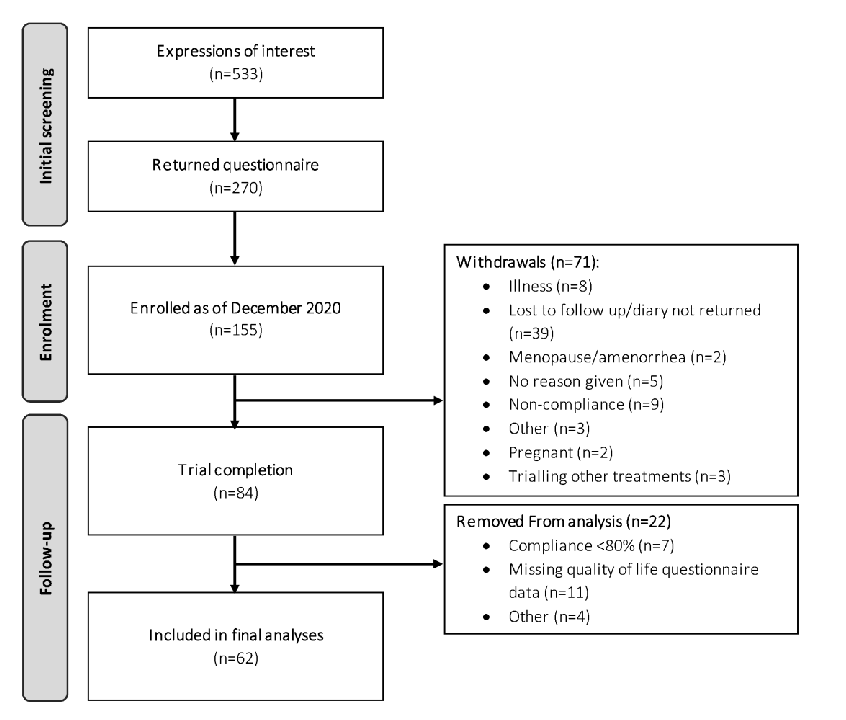
CONSORT diagram depicting flow of study participants.
A Randomised, Double-Blind, Placebo-Controlled Crossover Trial of Resveratrol Supplementation for Prophylaxis of …