Uridine Monophosphate Figures
11 figures from peer-reviewed research
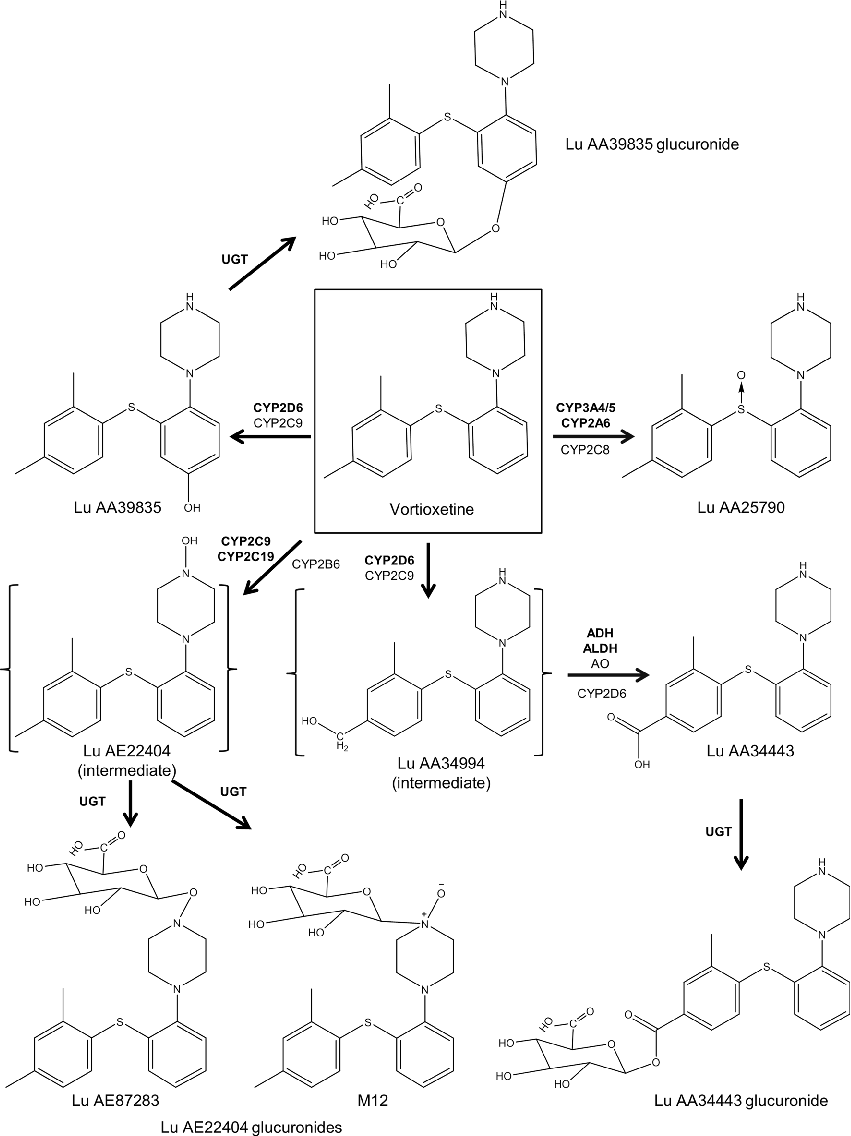
Comprehensive drug interaction summary for vortioxetine, including effects on and by concomitant medications. Clinicians are advised to consider CYP2D6 inhibitor status when prescribing vortioxetine.
Vortioxetine: Clinical Pharmacokinetics and Drug Interactions.
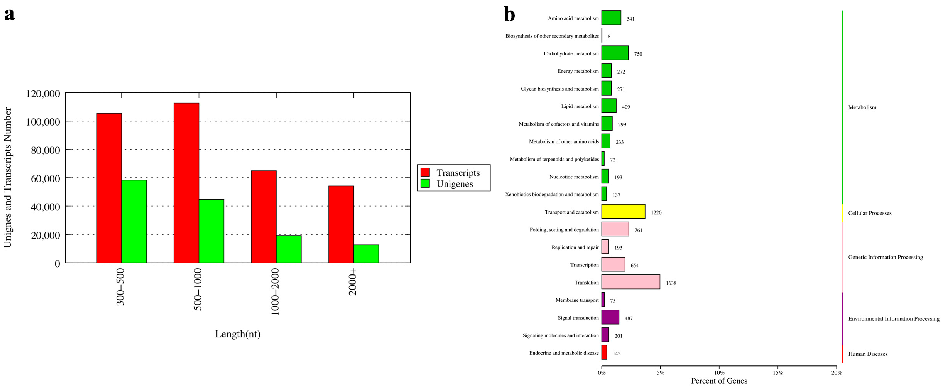
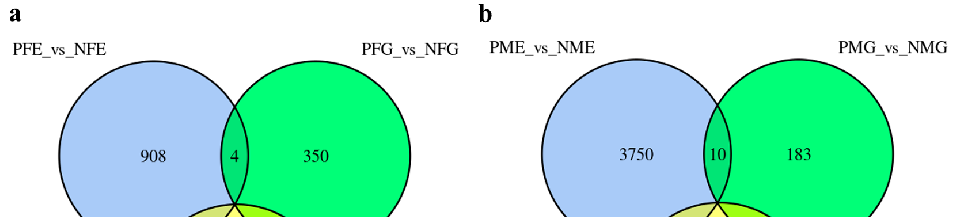
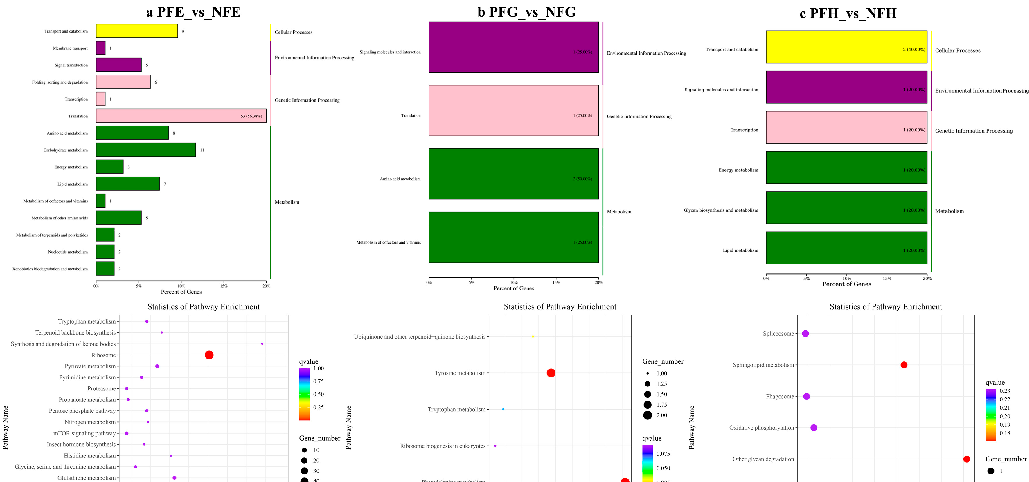
Metabolomics profiling identifies significantly altered metabolites in precocious versus normal crabs, with enrichment in lipid and amino acid metabolic pathways.
Integrated Analysis of Transcriptomics and Metabolomics Unveil the Novel Insight of One-Year-Old …
Principal component analysis of metabolomic data separates precocious from normally developing crabs based on their distinct metabolic profiles.
Integrated Analysis of Transcriptomics and Metabolomics Unveil the Novel Insight of One-Year-Old …
Volcano plot visualization highlights metabolites significantly enriched or depleted in precocious crabs compared to age-matched controls.
Integrated Analysis of Transcriptomics and Metabolomics Unveil the Novel Insight of One-Year-Old …
Heatmap of top differentially abundant metabolites clusters precocious and normal crabs into distinct groups based on metabolic signatures.
Integrated Analysis of Transcriptomics and Metabolomics Unveil the Novel Insight of One-Year-Old …
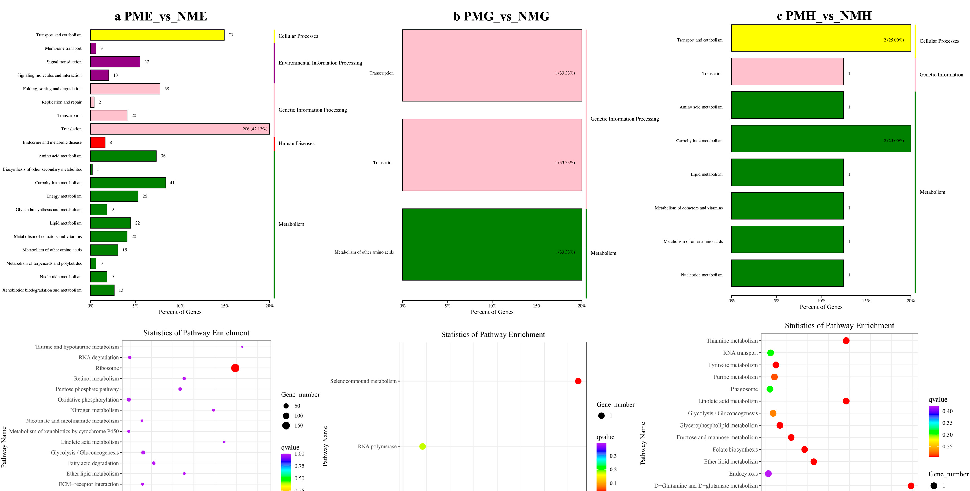
Lipid metabolite classes are quantified across crab groups, showing elevated steroid and fatty acid metabolites associated with the precocious phenotype.
Integrated Analysis of Transcriptomics and Metabolomics Unveil the Novel Insight of One-Year-Old …
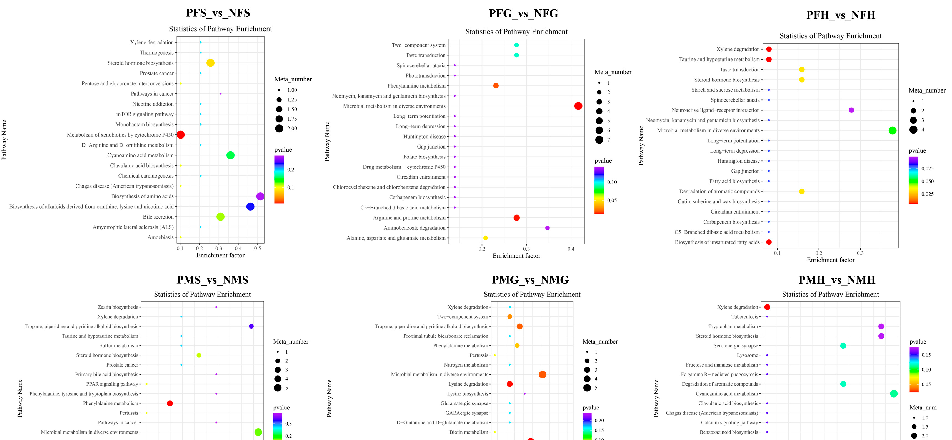
Integrated pathway visualization connects transcriptomic gene expression changes to metabolomic shifts in the phenylalanine metabolism pathway of precocious crabs.
Integrated Analysis of Transcriptomics and Metabolomics Unveil the Novel Insight of One-Year-Old …
Quantitative PCR validation confirms the differential expression of selected genes identified in the transcriptomic analysis between precocious and normal crabs.
Integrated Analysis of Transcriptomics and Metabolomics Unveil the Novel Insight of One-Year-Old …
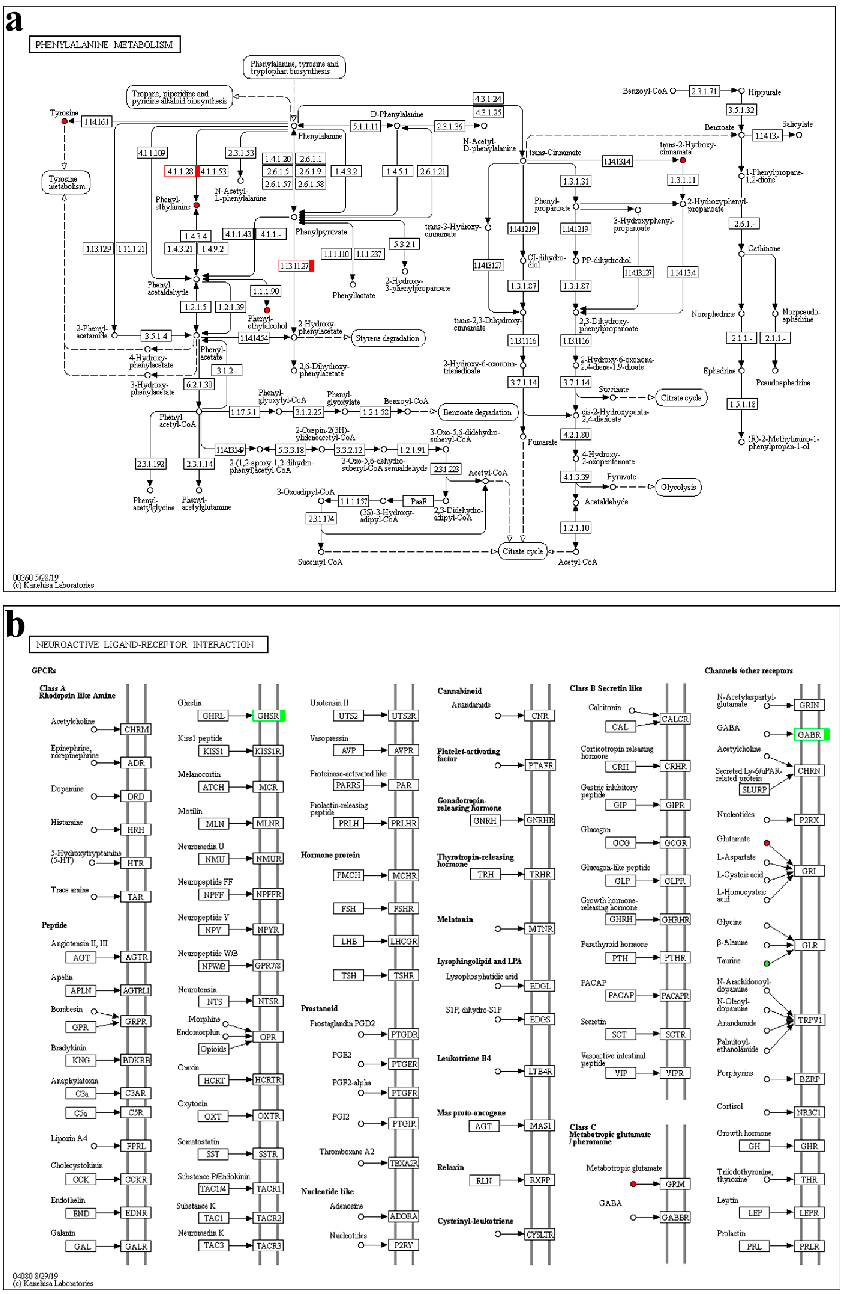
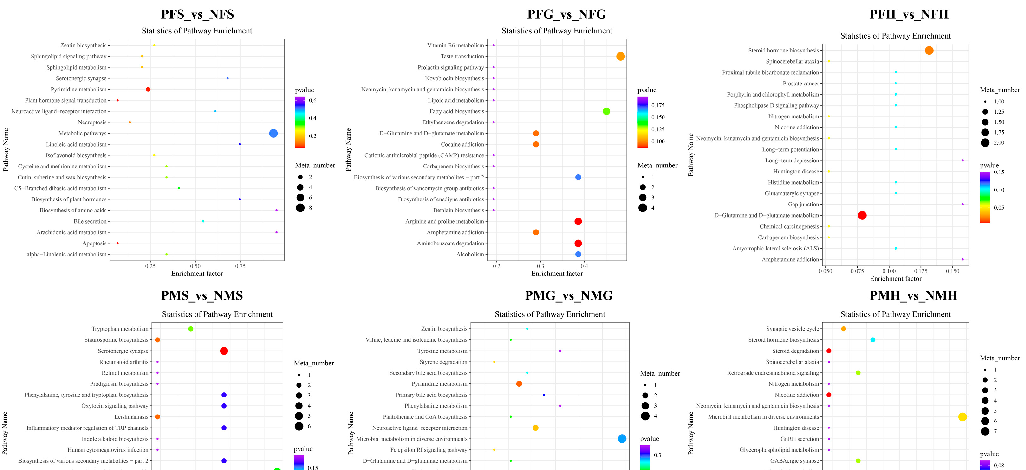
KEGG pathway maps for phenylalanine metabolism and neuroactive ligand-receptor interaction show up- and down-regulated components in precocious crabs, with red indicating increased expression.
Integrated Analysis of Transcriptomics and Metabolomics Unveil the Novel Insight of One-Year-Old …
Supplementary integrated analysis data provides additional support for the multi-omics characterization of precocious development in Eriocheir sinensis.
Integrated Analysis of Transcriptomics and Metabolomics Unveil the Novel Insight of One-Year-Old …
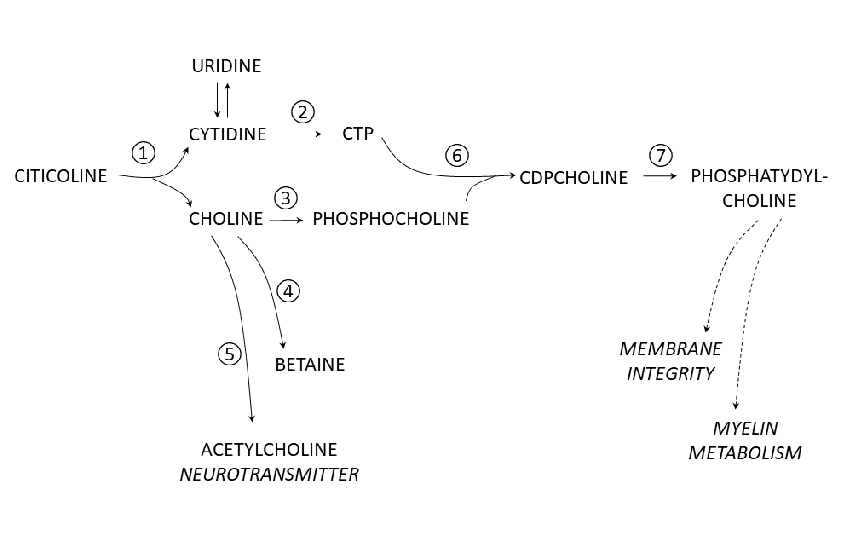
Statistical analysis from research investigating citicoline for Supporting Memory in Aging Humans, comparing treatment groups and control conditions.
Citicoline for Supporting Memory in Aging Humans.