説明
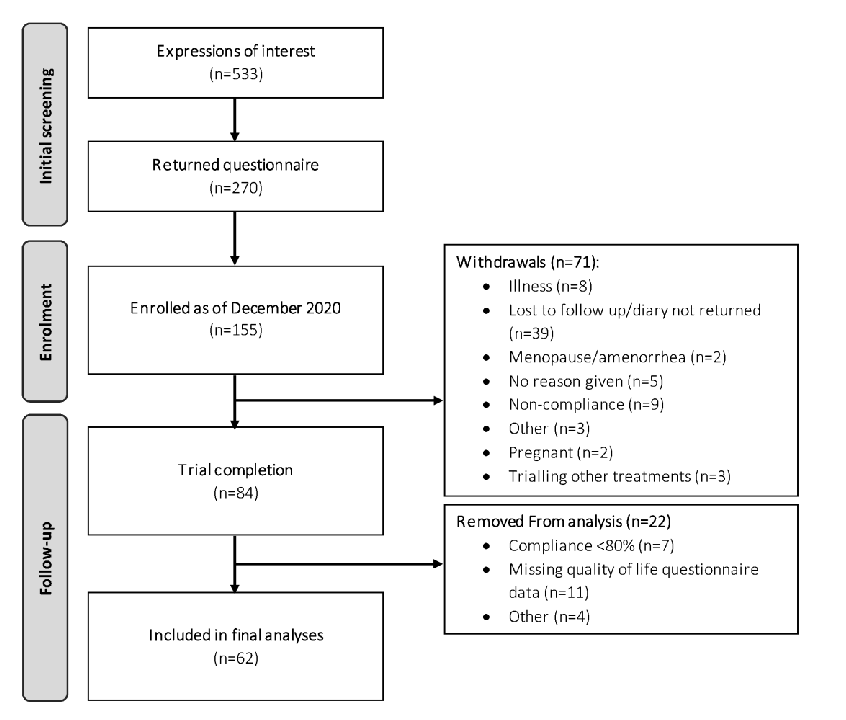
CONSORT diagram depicting flow of study participants.
Figure 6
Flowchart
846 × 720px
· 63.3 KB
Source Paper
A Randomised, Double-Blind, Placebo-Controlled Crossover Trial of Resveratrol Supplementation for Prophylaxis of Hormonal Migraine.Cite This Figure
 > Source: Jemima S A Dzator et al. "A Randomised, Double-Blind, Placebo-Controlled Crossover Trial of Resveratrol Su." *Nutrients*, 2022. PMID: [35565731](https://pubmed.ncbi.nlm.nih.gov/35565731/)
<figure>
  <img src="https://pdfs.citedhealth.com/figures/35565731/157.png" alt="CONSORT diagram depicting flow of study participants." />
  <figcaption>Figure 6. CONSORT diagram depicting flow of study participants.<br>  Source: Jemima S A Dzator et al. "A Randomised, Double-Blind, Placebo-Controlled Crossover Trial of Resveratrol Su." <em>Nutrients</em>, 2022. PMID: <a href="https://pubmed.ncbi.nlm.nih.gov/35565731/">35565731</a></figcaption>
</figure>