Omega-3 Fatty Acids (DHA/EPA) Abbildungen
115 Abbildungen aus begutachteter Forschung
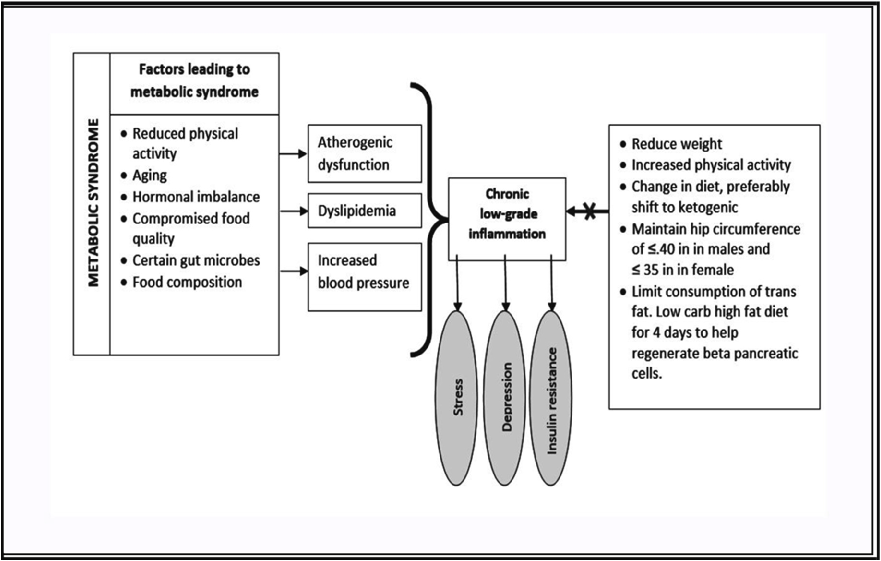
A schematic representation maps the factors contributing to metabolic syndrome alongside corresponding dietary and lifestyle modifications that may alleviate these conditions, integrating evidence on stress management and anti-inflammatory nutrition.
A review on linking stress, depression, and insulin resistance via low-grade chronic …
Major pharmacotherapeutic targets in Alzheimer's disease are mapped, including amyloid-beta aggregation, tau hyperphosphorylation, neuroinflammation, and cholinergic dysfunction as key intervention points.
Review of Pharmacotherapeutic Targets in Alzheimer's Disease and Its Management Using Traditional …
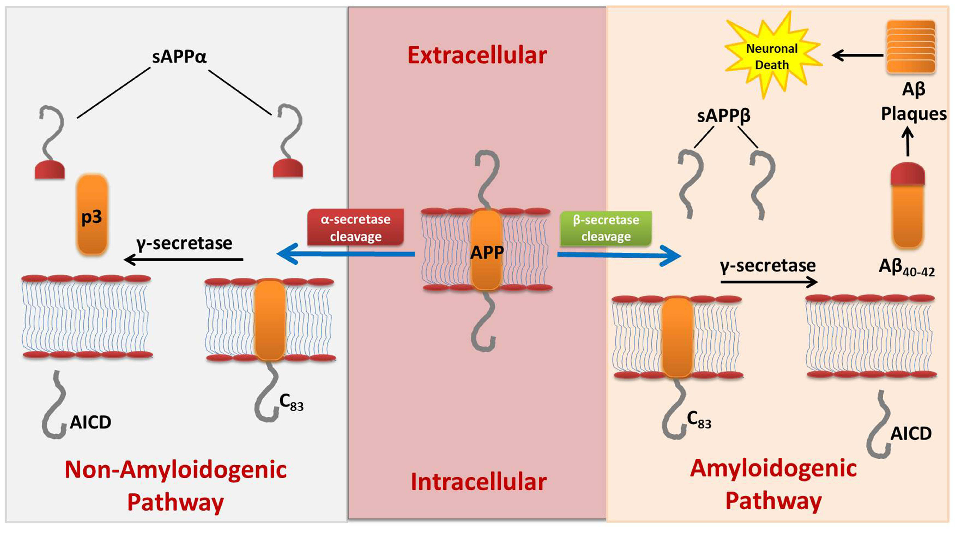
The amyloid cascade hypothesis and its therapeutic targets are illustrated, showing how beta-secretase and gamma-secretase inhibitors, along with anti-amyloid antibodies, aim to reduce pathological plaque formation.
Review of Pharmacotherapeutic Targets in Alzheimer's Disease and Its Management Using Traditional …
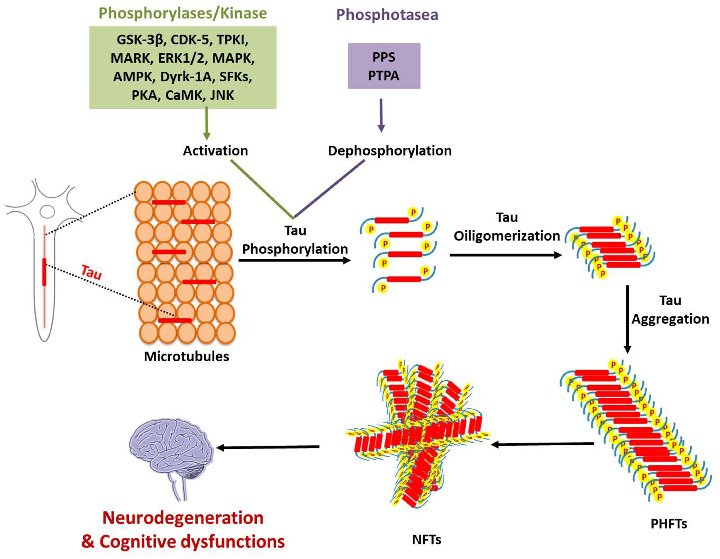
Tau protein pathology and potential therapeutic interventions are depicted, including kinase inhibitors and immunotherapy approaches targeting neurofibrillary tangle formation in Alzheimer's disease.
Review of Pharmacotherapeutic Targets in Alzheimer's Disease and Its Management Using Traditional …
Neuroinflammatory pathways in Alzheimer's disease and anti-inflammatory therapeutic targets are outlined, showing microglial activation, cytokine cascades, and potential points of pharmacological intervention.
Review of Pharmacotherapeutic Targets in Alzheimer's Disease and Its Management Using Traditional …
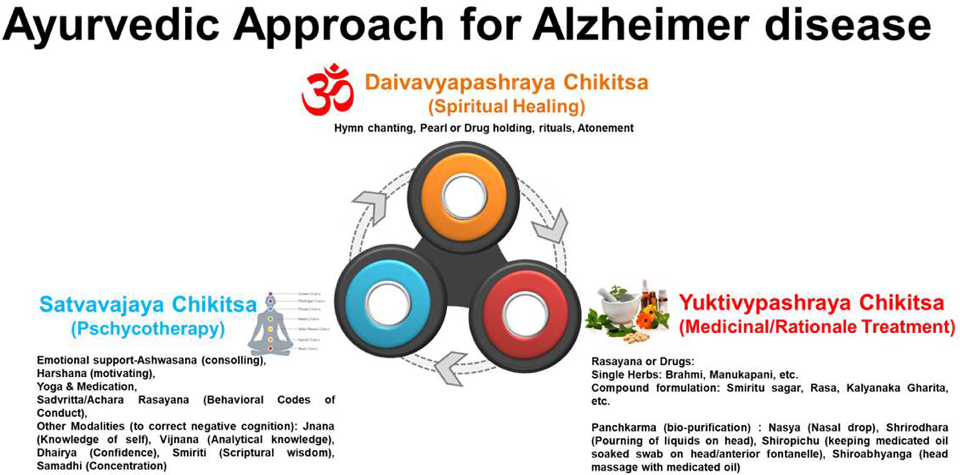
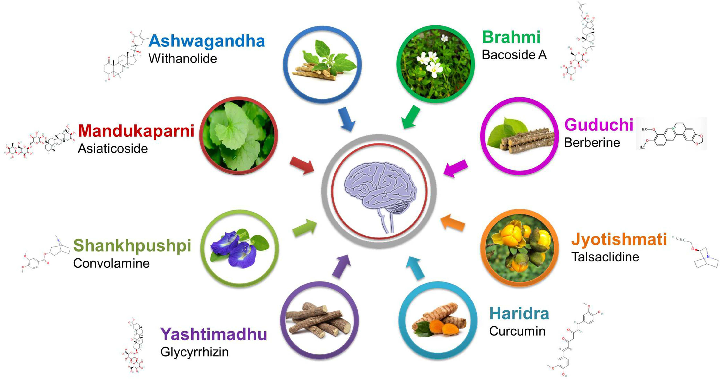
Traditional medicinal plants investigated for Alzheimer's management are catalogued with their bioactive compounds and proposed neuroprotective mechanisms, including antioxidant and anti-inflammatory activities.
Review of Pharmacotherapeutic Targets in Alzheimer's Disease and Its Management Using Traditional …
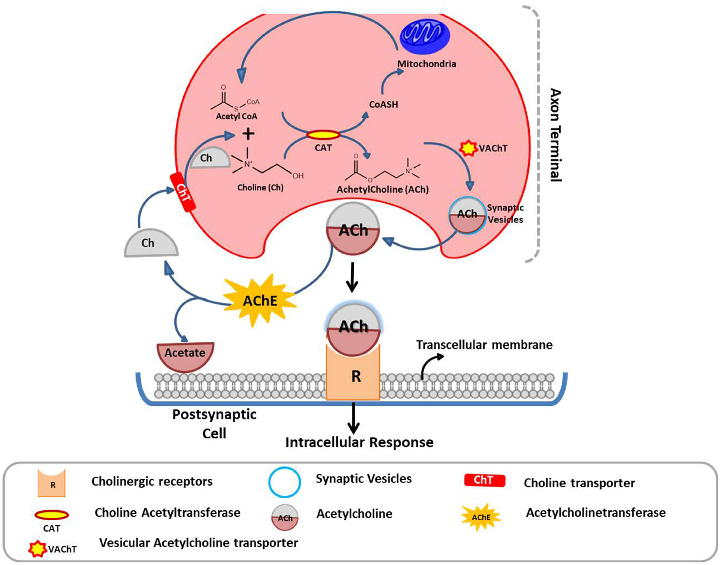
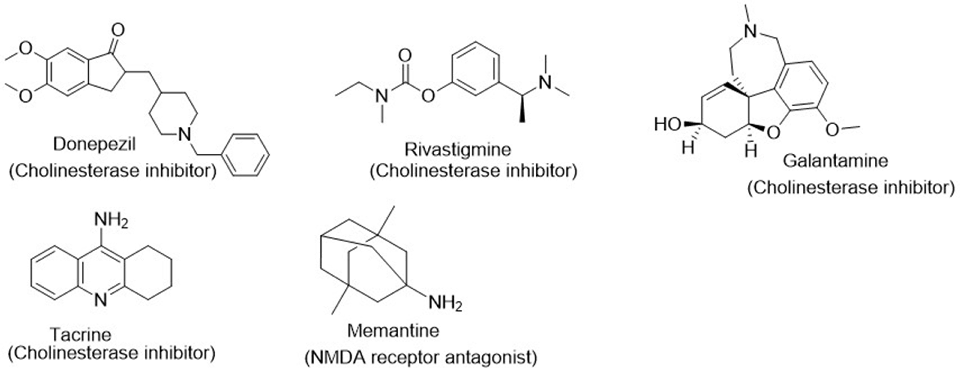
Cholinergic system dysfunction in Alzheimer's disease and current cholinesterase inhibitor therapies are illustrated, showing how acetylcholine deficiency contributes to cognitive decline.
Review of Pharmacotherapeutic Targets in Alzheimer's Disease and Its Management Using Traditional …
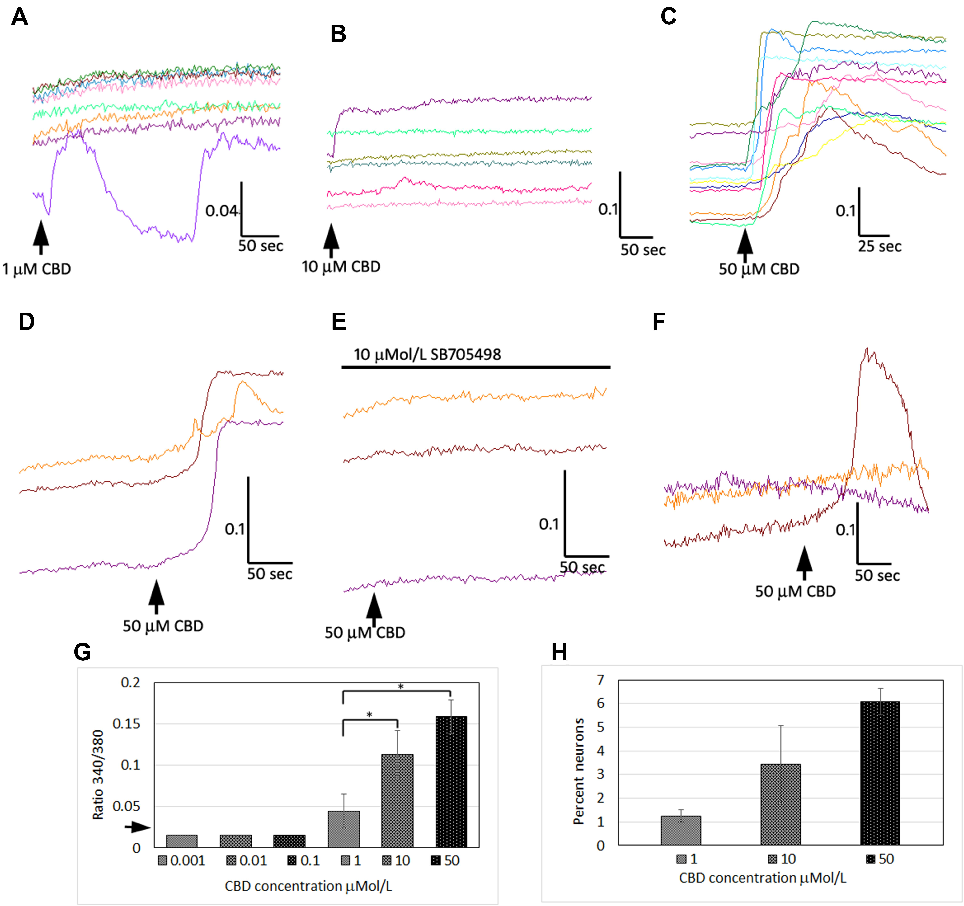
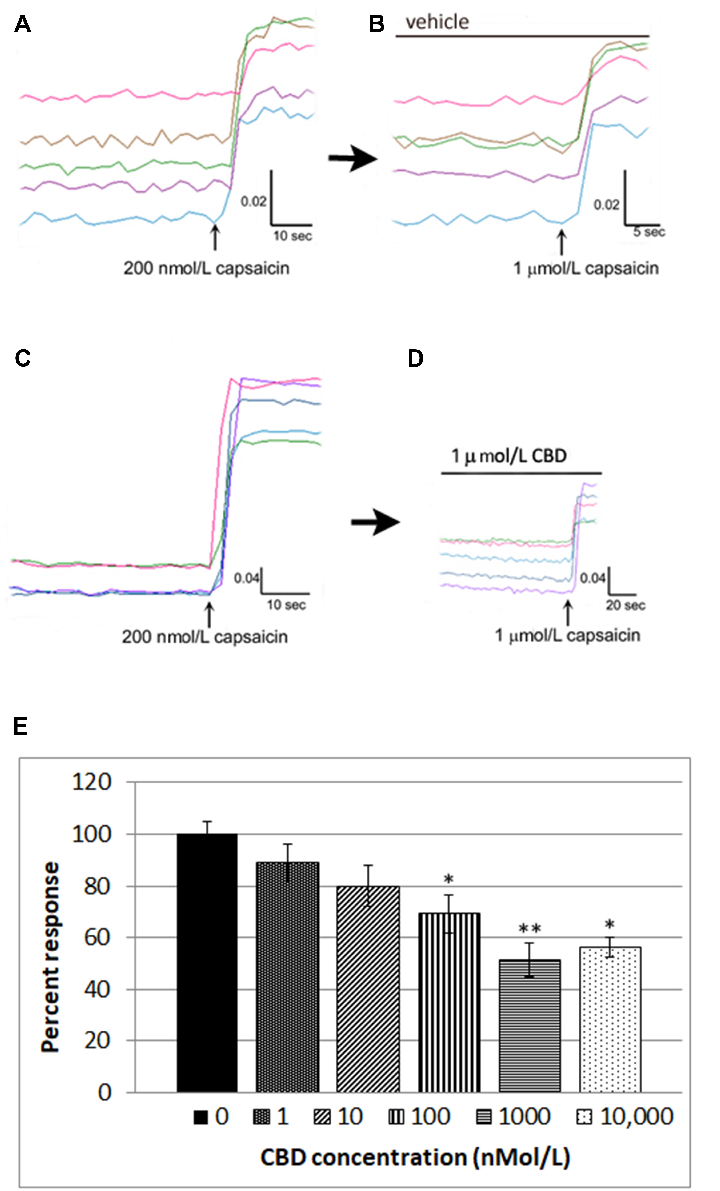
Calcium imaging or electrophysiological recordings from cultured DRG neurons demonstrating CBD's dose-dependent effects on TRPV1-mediated capsaicin responses and downstream signaling pathways.
CBD Effects on TRPV1 Signaling Pathways in Cultured DRG Neurons.
Calcium imaging or electrophysiological recordings from cultured DRG neurons demonstrating CBD's dose-dependent effects on TRPV1-mediated capsaicin responses and downstream signaling pathways.
CBD Effects on TRPV1 Signaling Pathways in Cultured DRG Neurons.
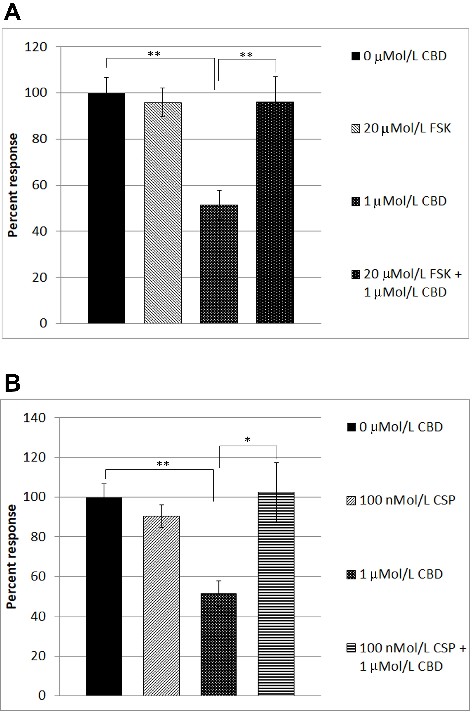
CBD-mediated TRPV1 desensitization was reversed by forskolin (cAMP pathway activator) and cyclosporin (calcineurin inhibitor), indicating that cannabidiol's analgesic mechanism involves phosphatase-dependent receptor desensitization in DRG neurons.
CBD Effects on TRPV1 Signaling Pathways in Cultured DRG Neurons.
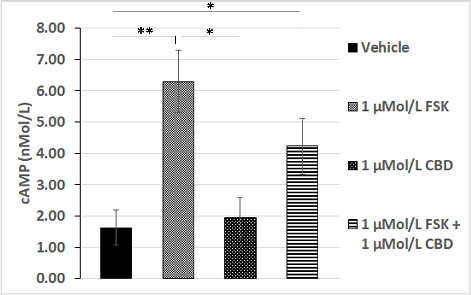
Forskolin-stimulated cAMP levels were significantly inhibited by CBD co-treatment in DRG neurons, suggesting cannabidiol modulates the cAMP-PKA signaling axis downstream of TRPV1 activation.
CBD Effects on TRPV1 Signaling Pathways in Cultured DRG Neurons.
[Not Available].
[Not Available].
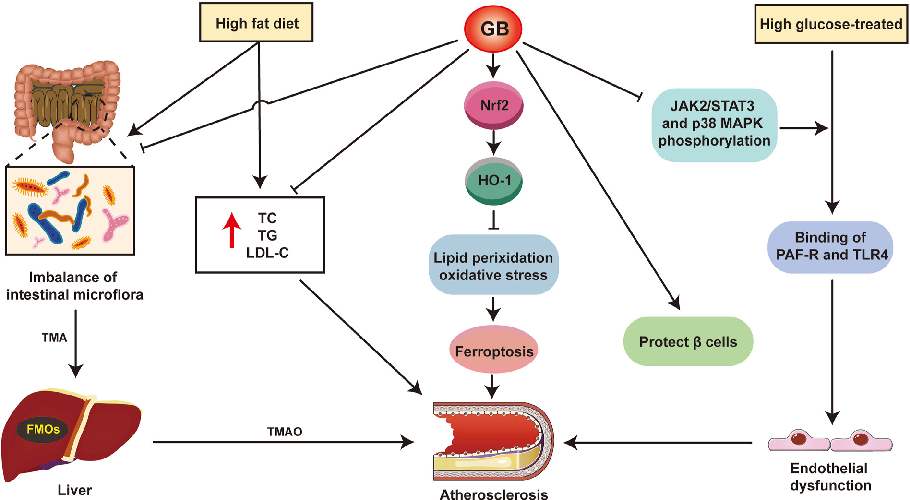
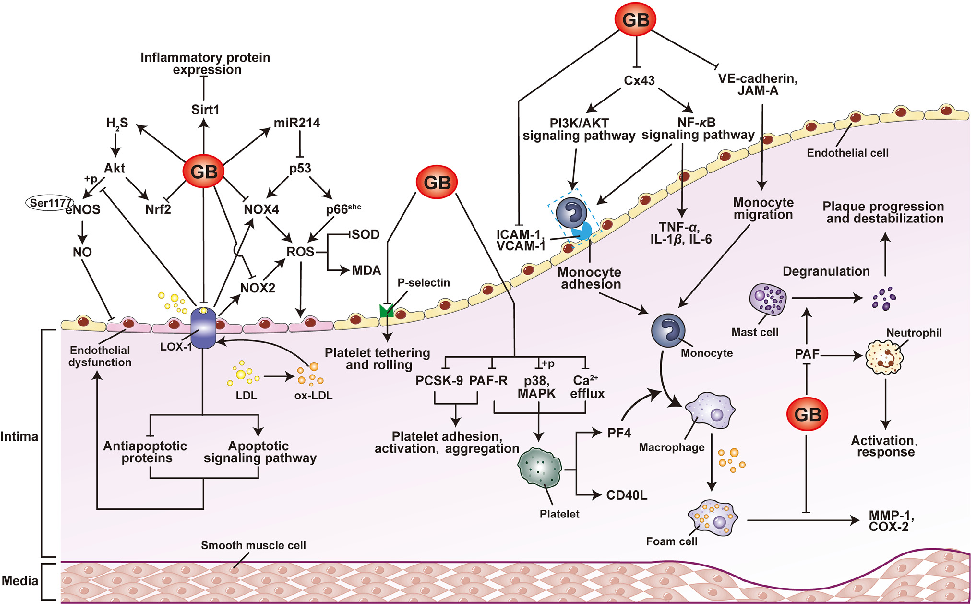
Figure 4 Diagram of the mechanism of GB on independent risk factors for atherosclerosis. Trimethylamine N-oxide (TMAO) levels in the blood can be utilized as a predictor of early atherosclerosis. …
[Not Available].

Formulation, characterization, and evaluation of curcumin-loaded ginger-derived nanovesicles for anti-colitis activity.
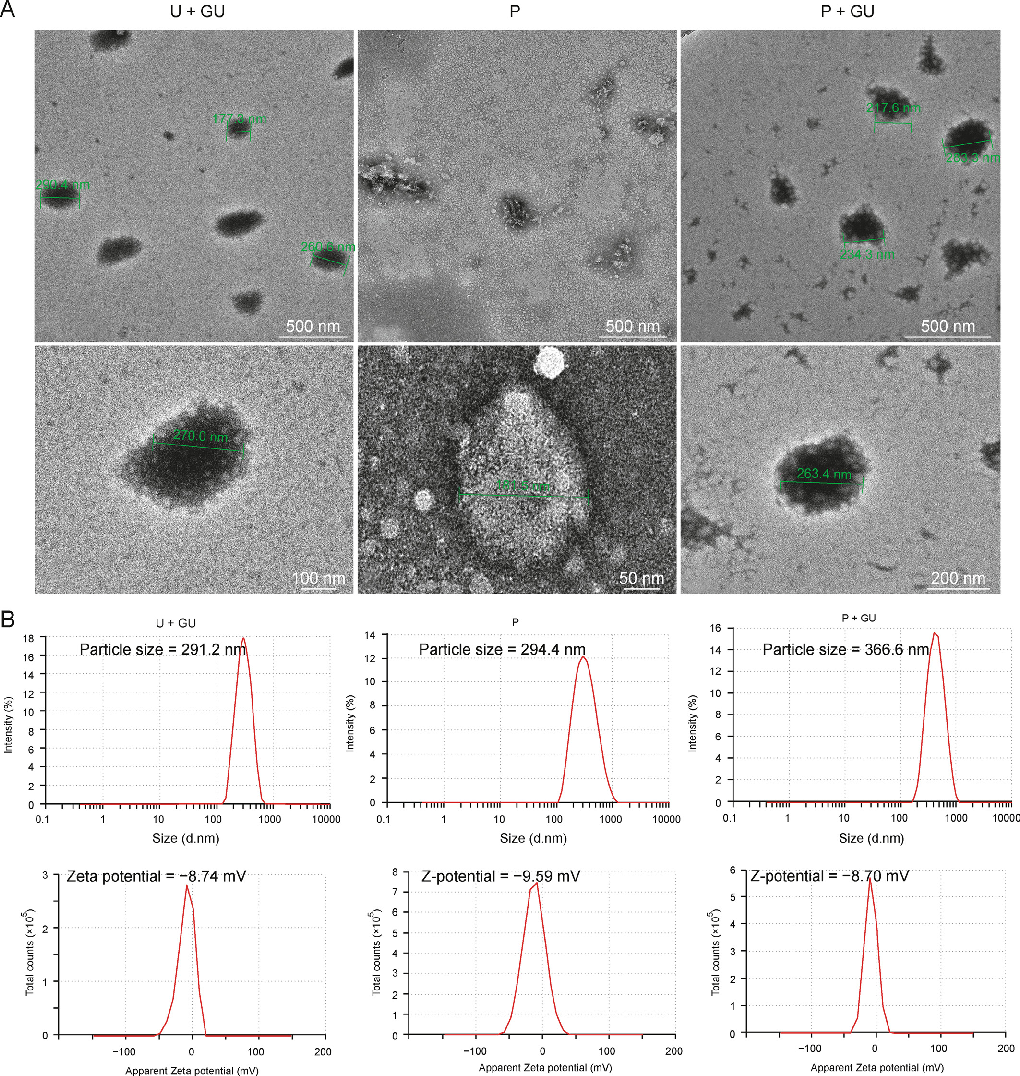
Formulation, characterization, and evaluation of curcumin-loaded ginger-derived nanovesicles for anti-colitis activity.
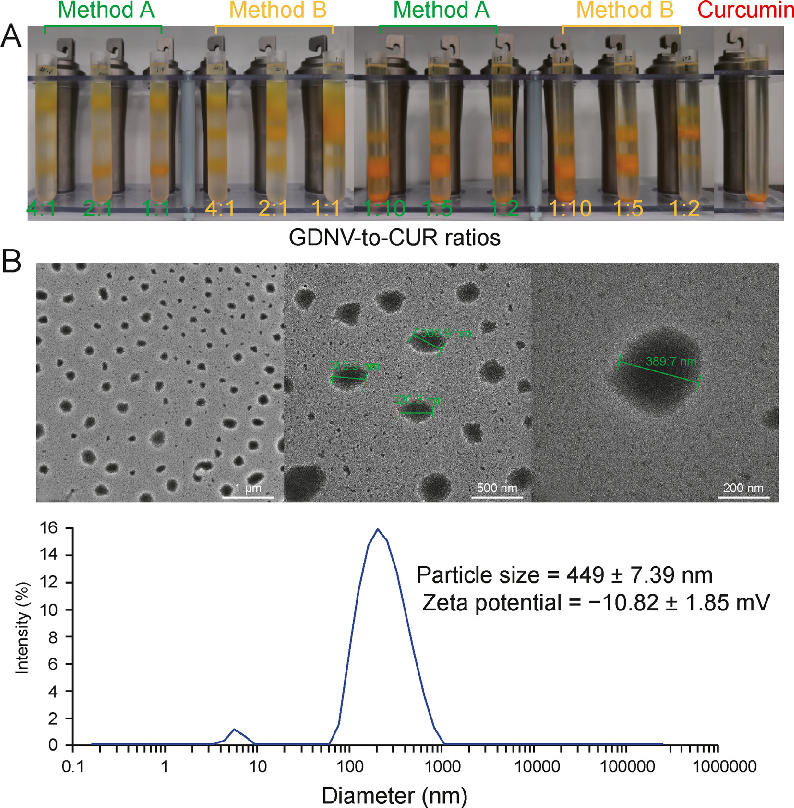
Formulation, characterization, and evaluation of curcumin-loaded ginger-derived nanovesicles for anti-colitis activity.
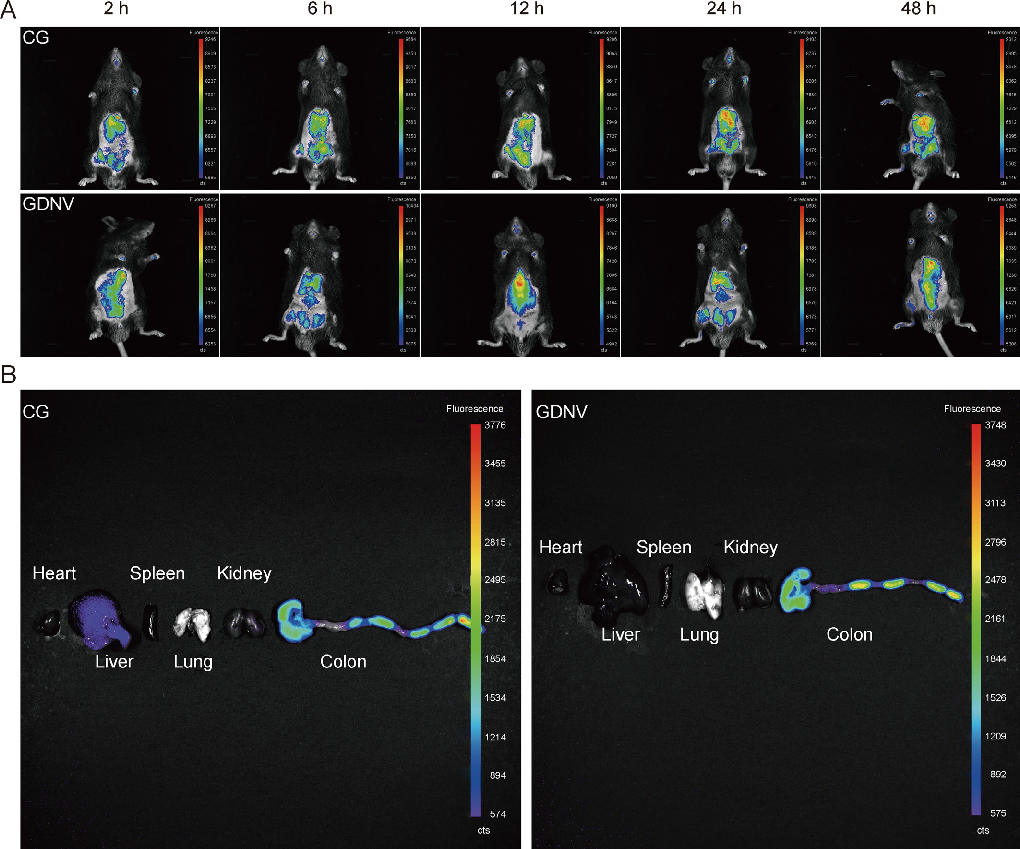
Formulation, characterization, and evaluation of curcumin-loaded ginger-derived nanovesicles for anti-colitis activity.
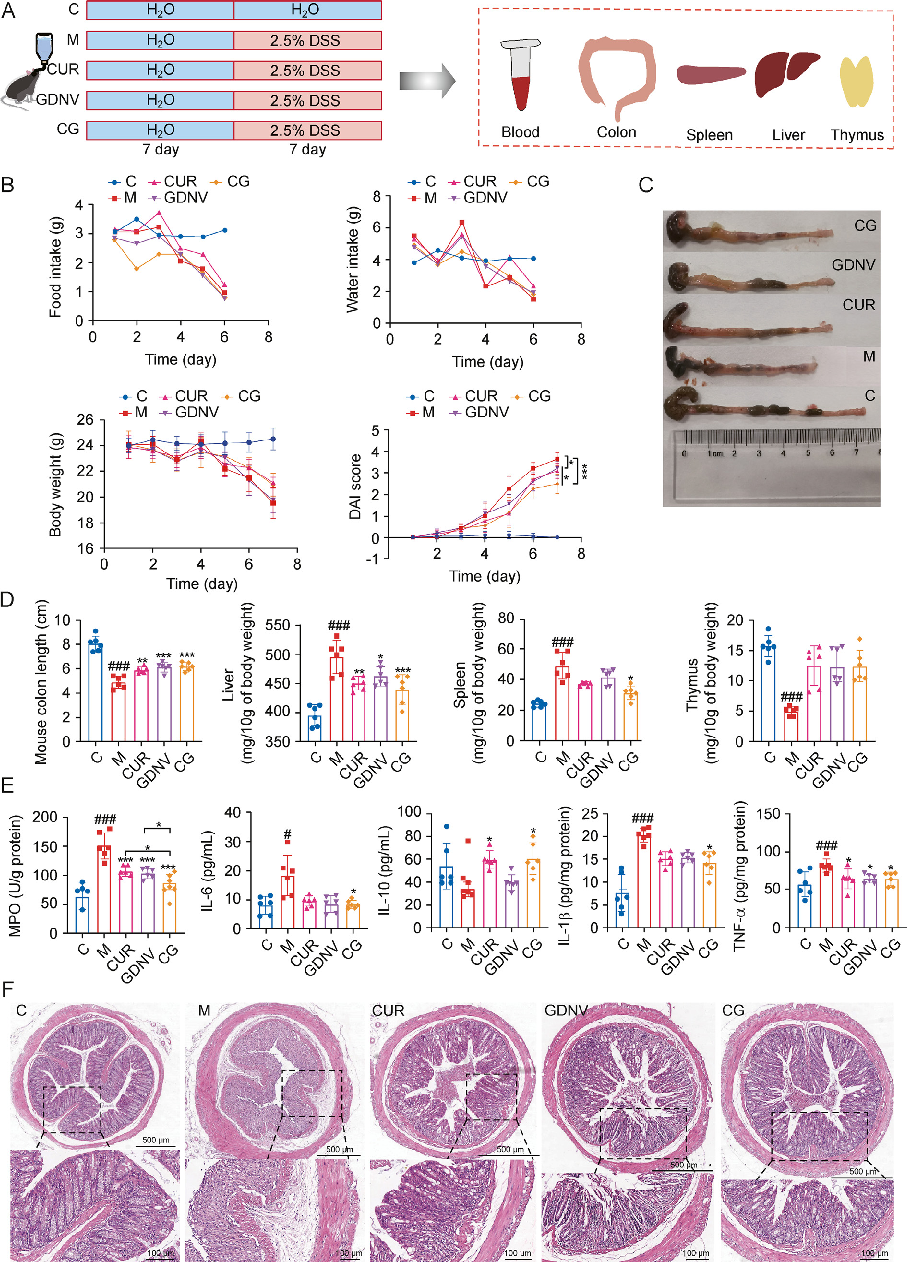
Formulation, characterization, and evaluation of curcumin-loaded ginger-derived nanovesicles for anti-colitis activity.
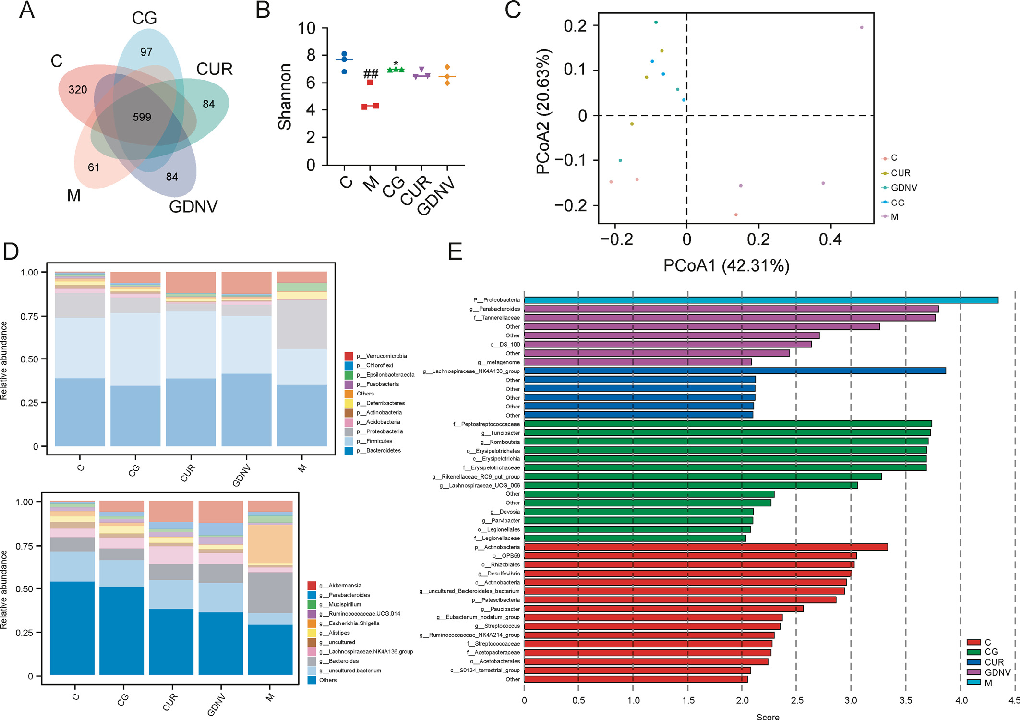
Formulation, characterization, and evaluation of curcumin-loaded ginger-derived nanovesicles for anti-colitis activity.
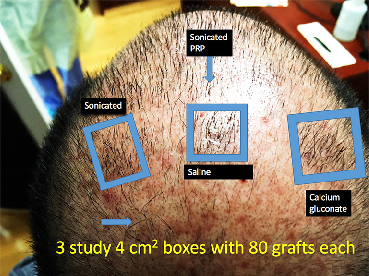
Alopecia and platelet-derived therapies.
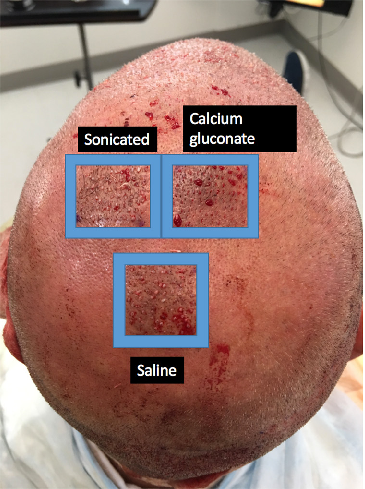
Alopecia and platelet-derived therapies.
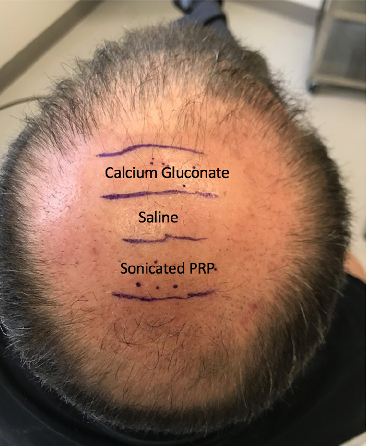
Figure 3 Location of the PL, AA-PRP, and saline treatment zones for Subject C. Forty grafts were placed in each box, and hair checks were conducted 14 weeks post-surgery. PL, …
Alopecia and platelet-derived therapies.
Alopecia and platelet-derived therapies.
Seite 2 von 5