Taurine Figures
19 figures from peer-reviewed research
g r a p h i c a l a b s t r a c t
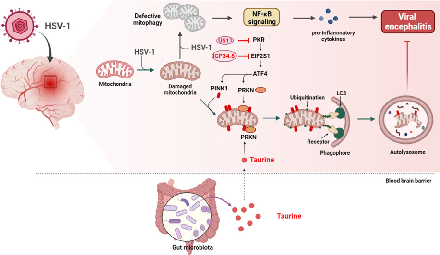
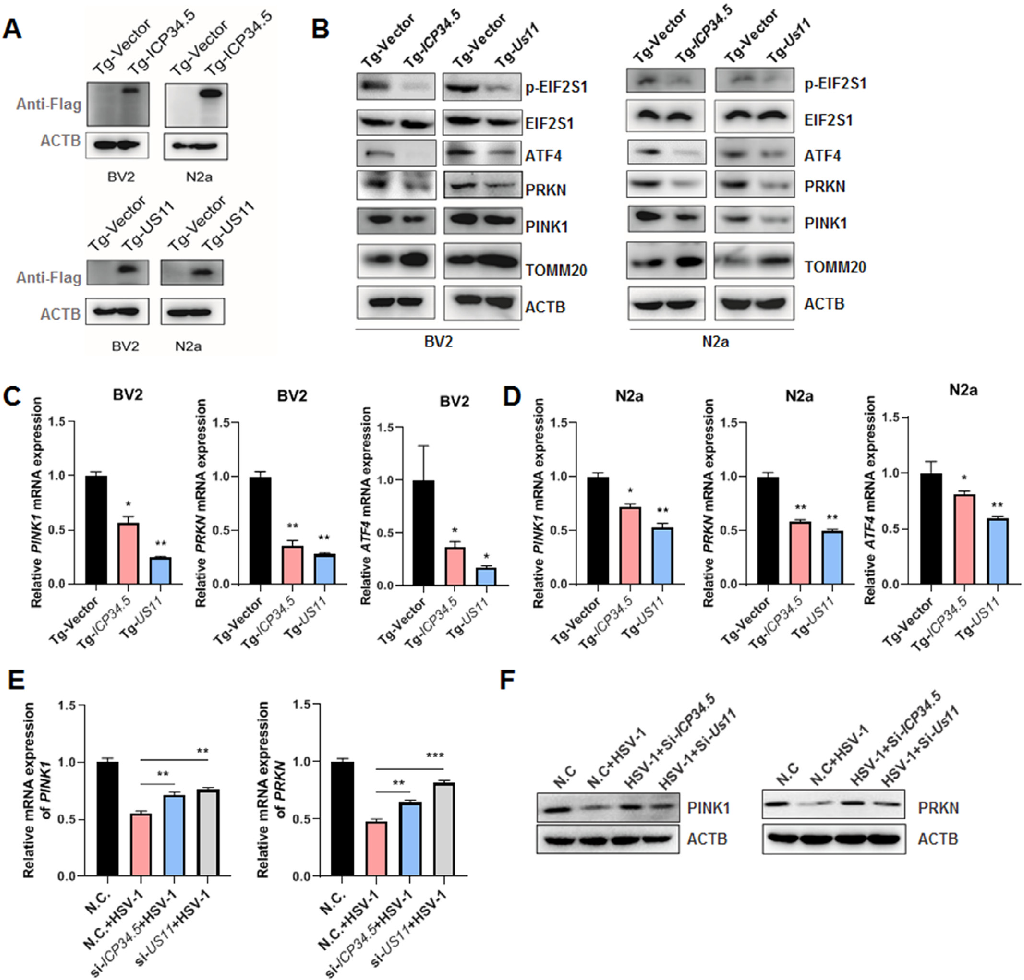
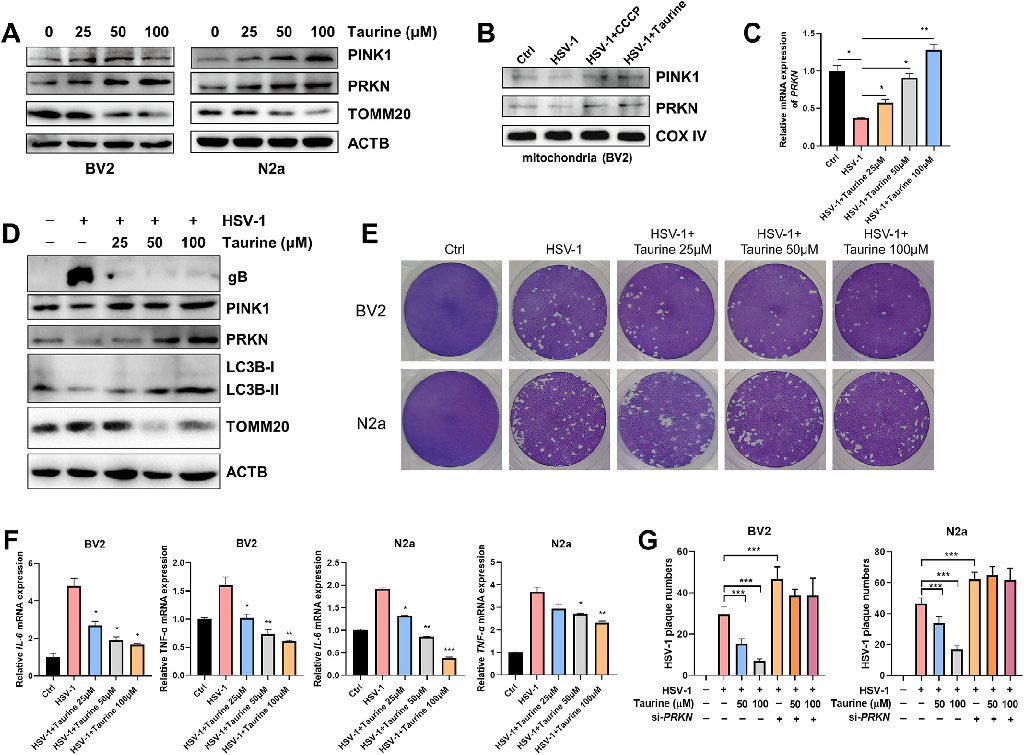
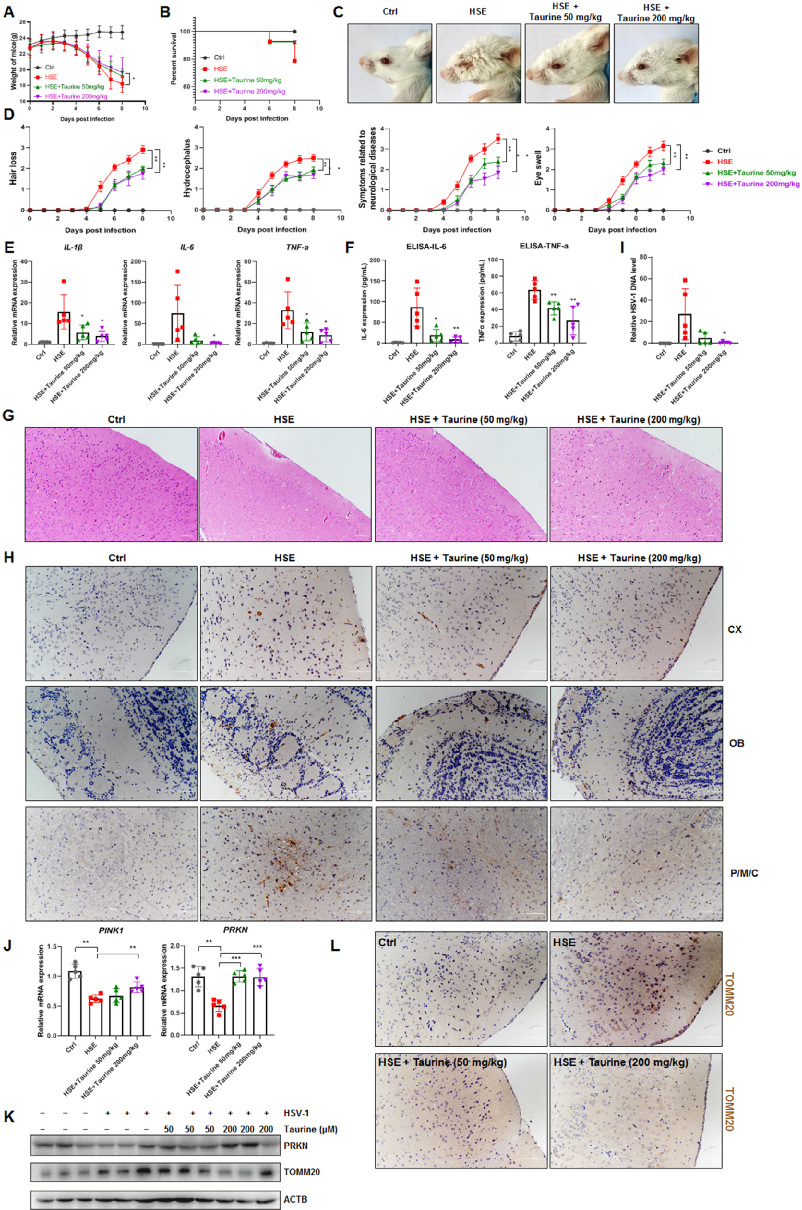
Inhibition of mitophagy via the EIF2S1-ATF4-PRKN pathway contributes to viral encephalitis.
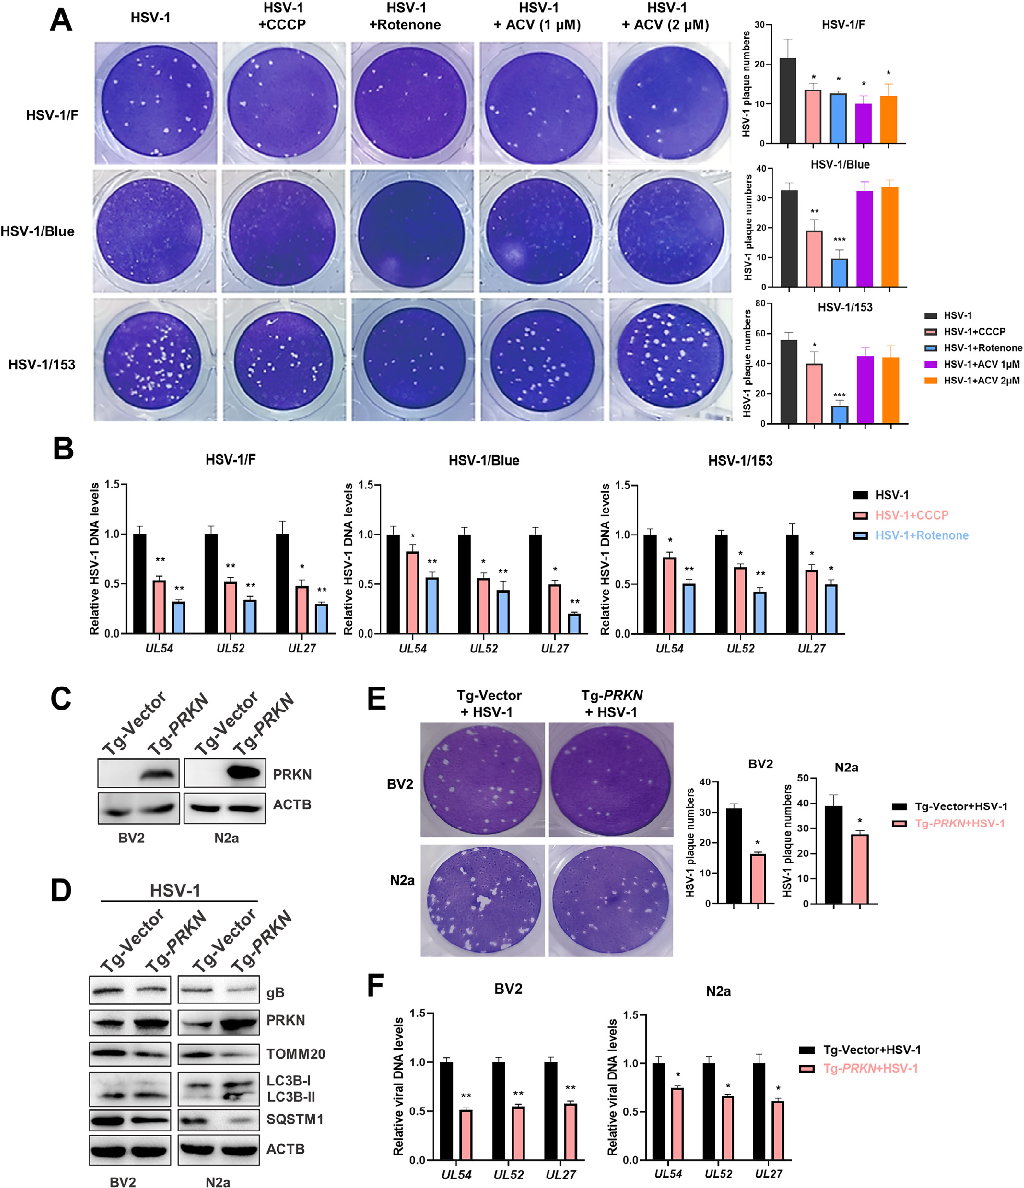
Inhibition of mitophagy via the EIF2S1-ATF4-PRKN pathway contributes to viral encephalitis.
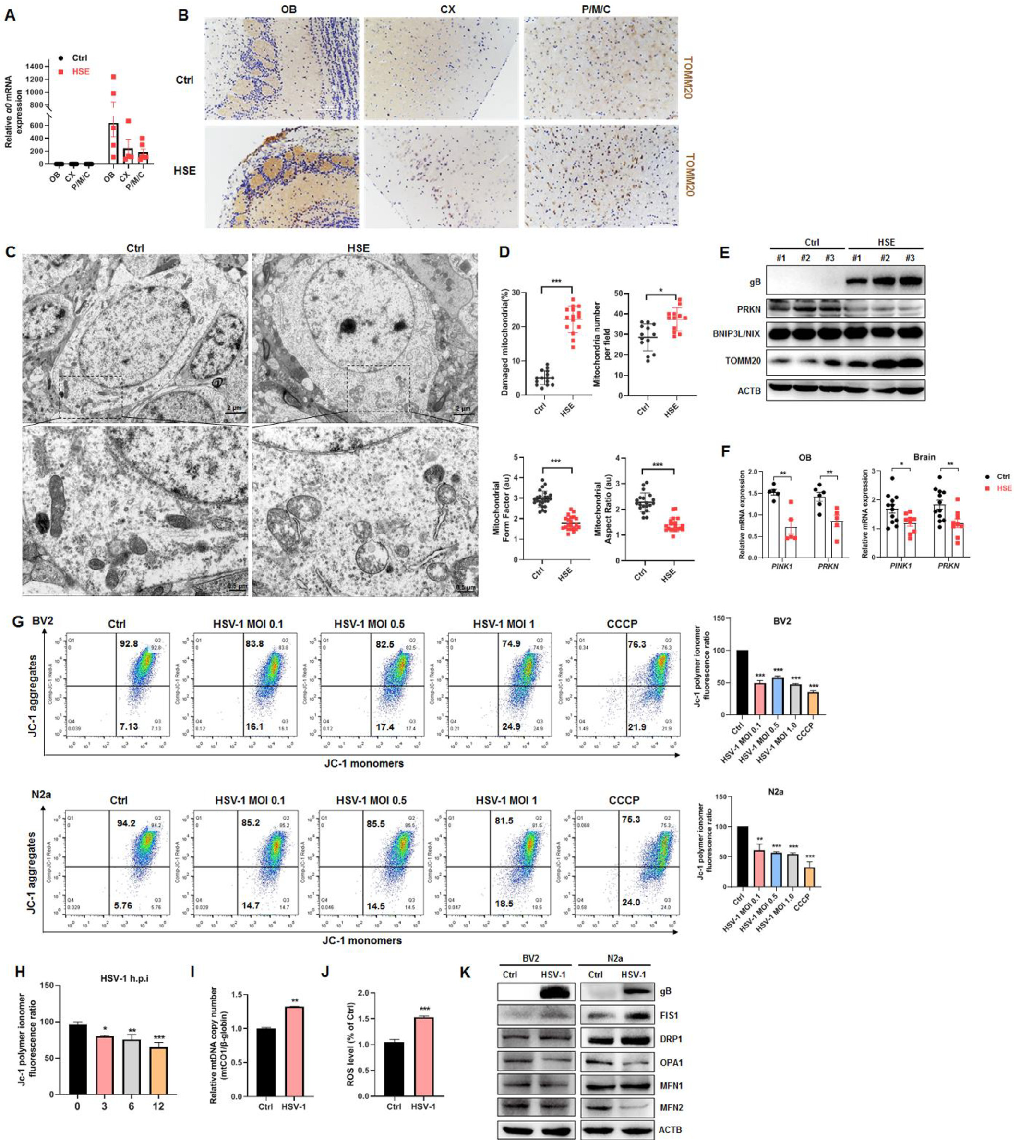
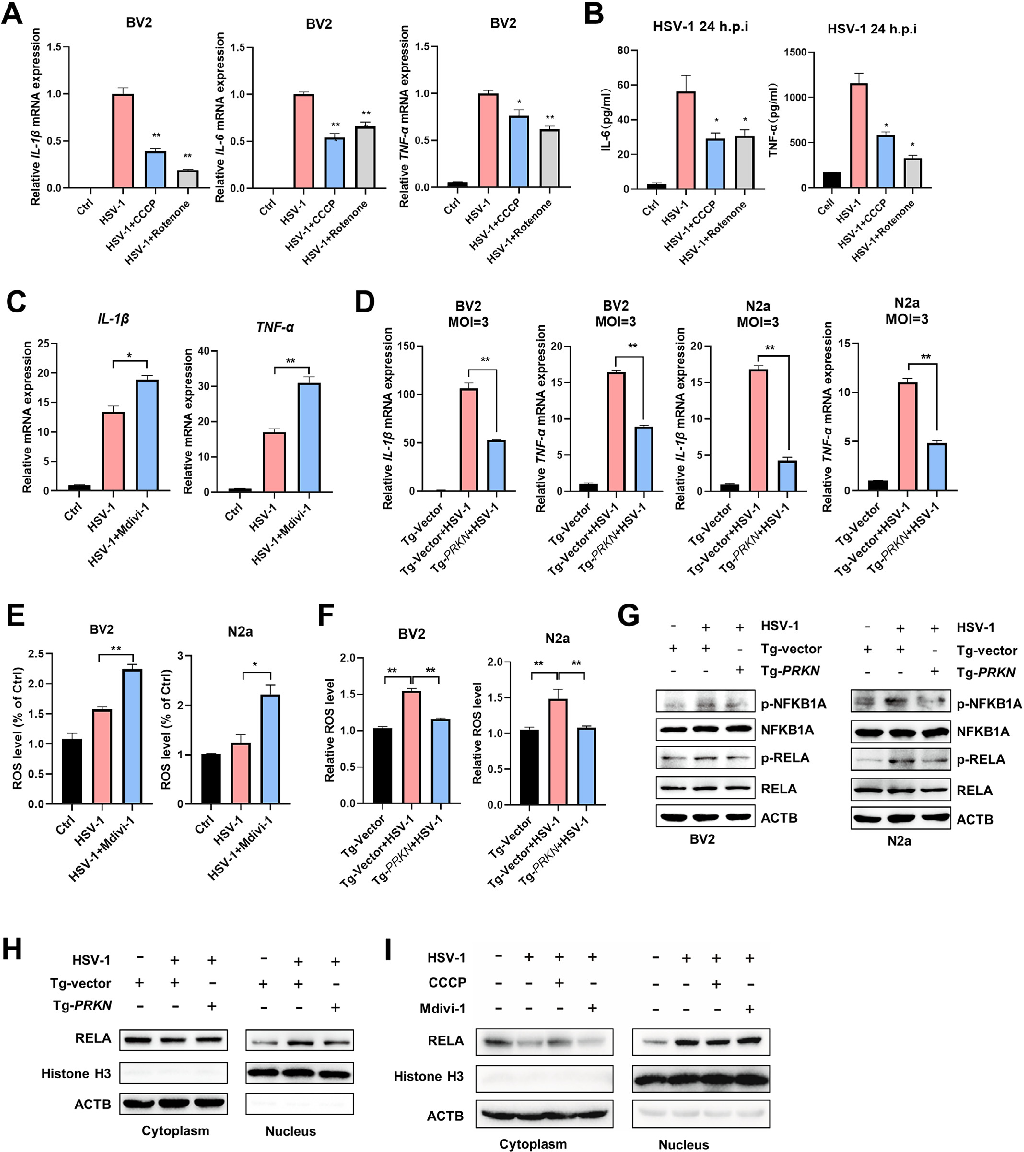
Inhibition of mitophagy via the EIF2S1-ATF4-PRKN pathway contributes to viral encephalitis.
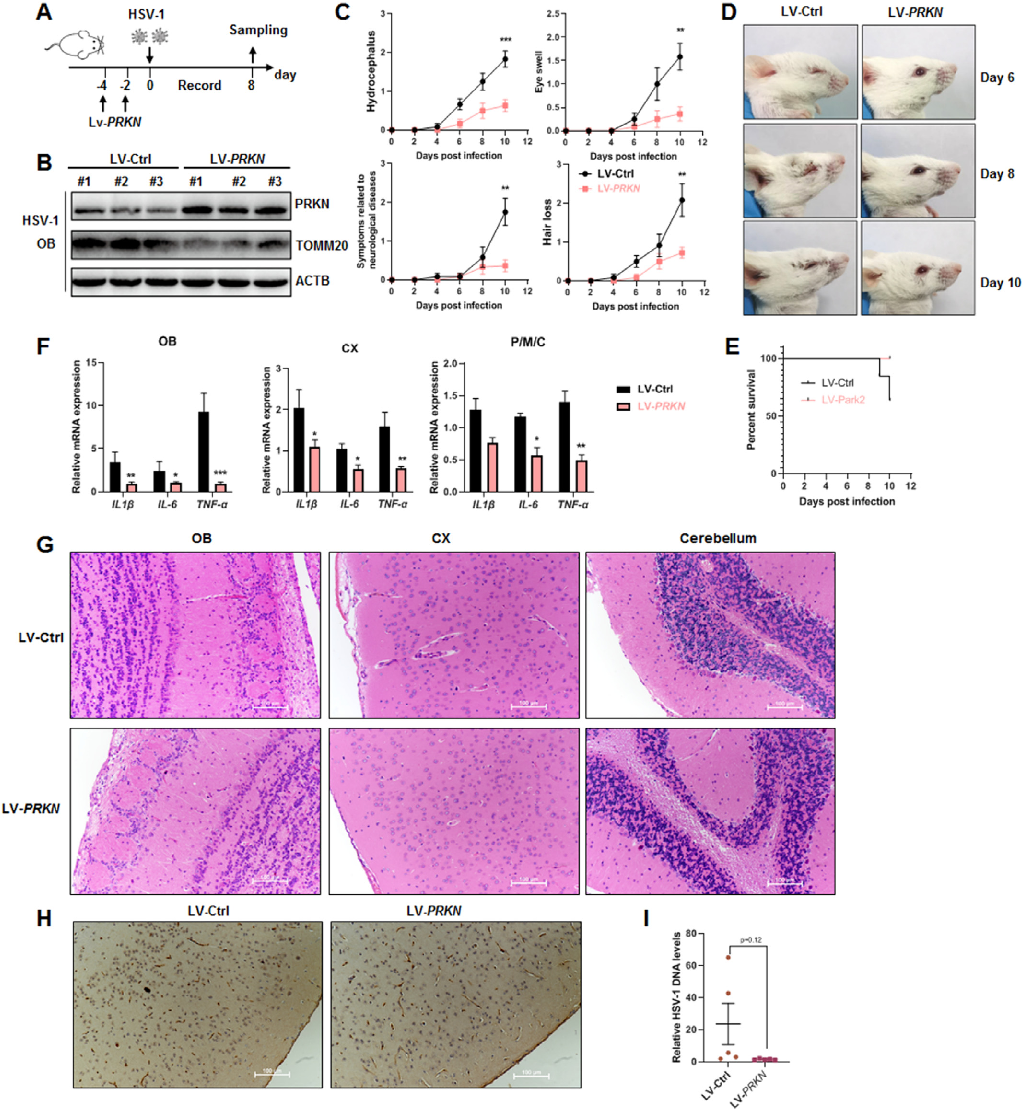
Inhibition of mitophagy via the EIF2S1-ATF4-PRKN pathway contributes to viral encephalitis.
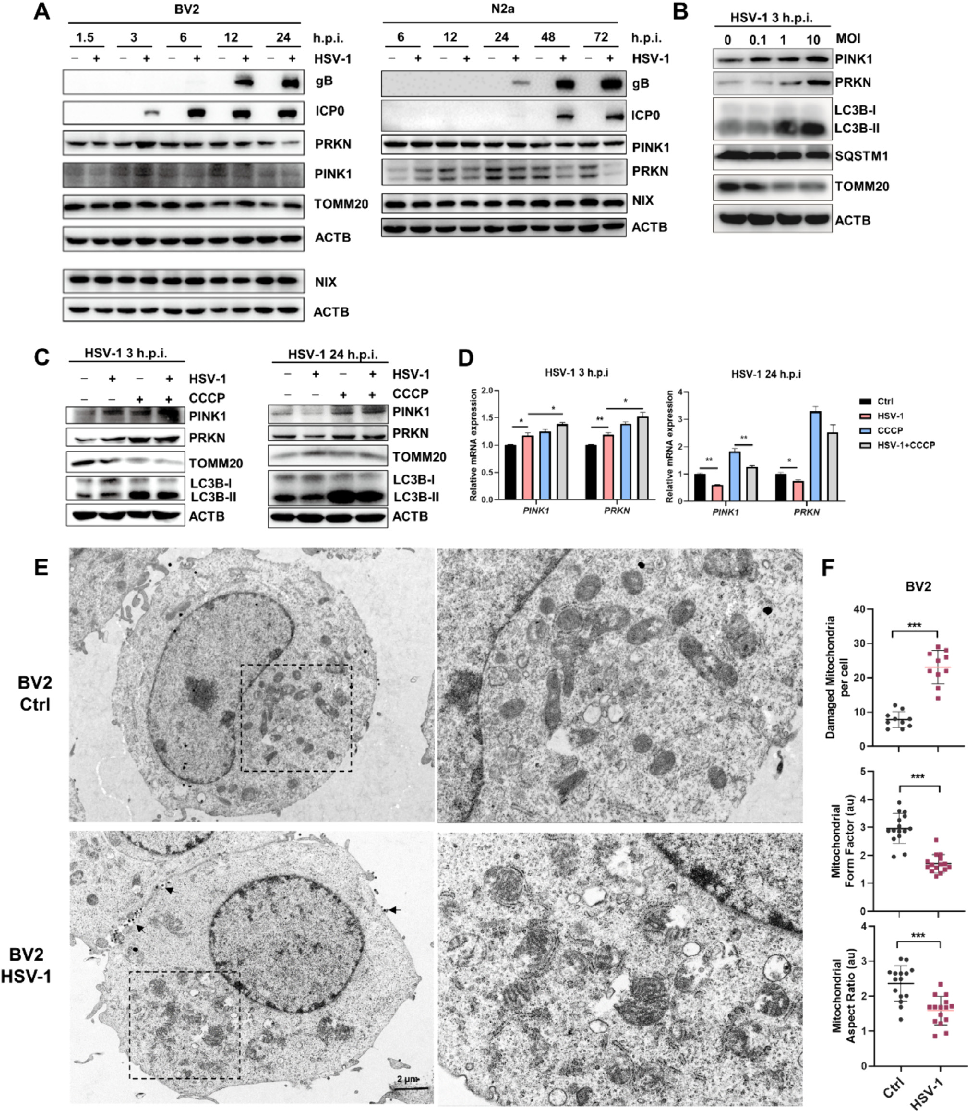
Inhibition of mitophagy via the EIF2S1-ATF4-PRKN pathway contributes to viral encephalitis.
Inhibition of mitophagy via the EIF2S1-ATF4-PRKN pathway contributes to viral encephalitis.
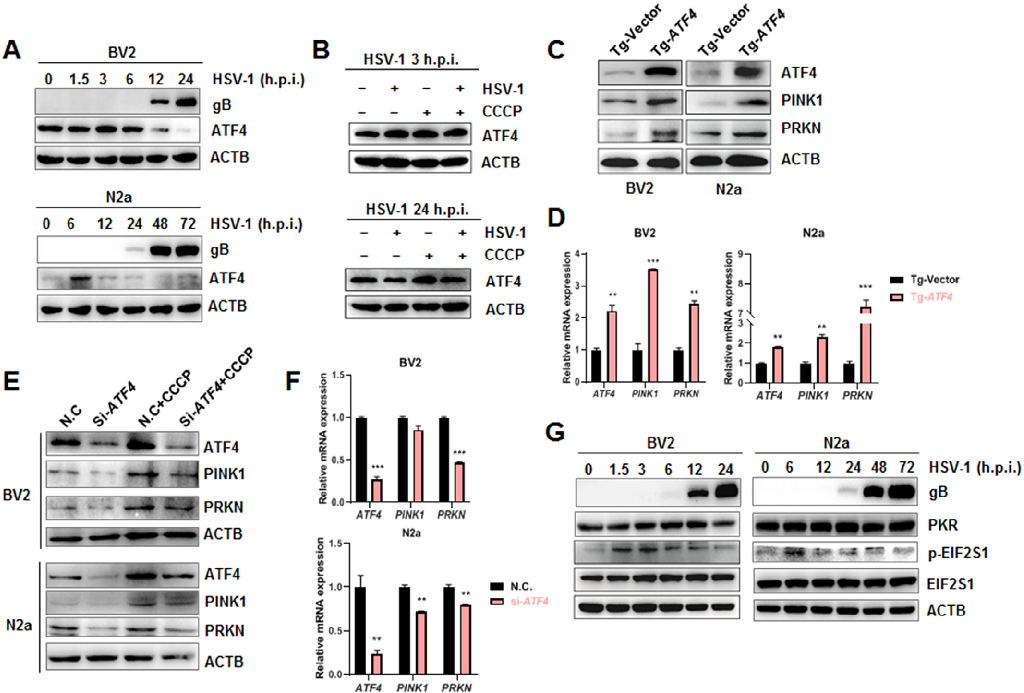
Inhibition of mitophagy via the EIF2S1-ATF4-PRKN pathway contributes to viral encephalitis.
Inhibition of mitophagy via the EIF2S1-ATF4-PRKN pathway contributes to viral encephalitis.
Inhibition of mitophagy via the EIF2S1-ATF4-PRKN pathway contributes to viral encephalitis.
Inhibition of mitophagy via the EIF2S1-ATF4-PRKN pathway contributes to viral encephalitis.
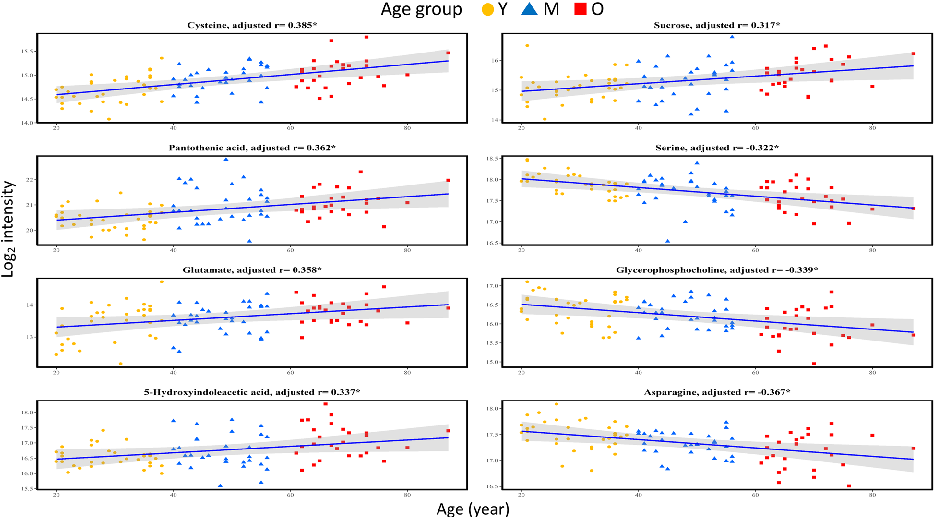
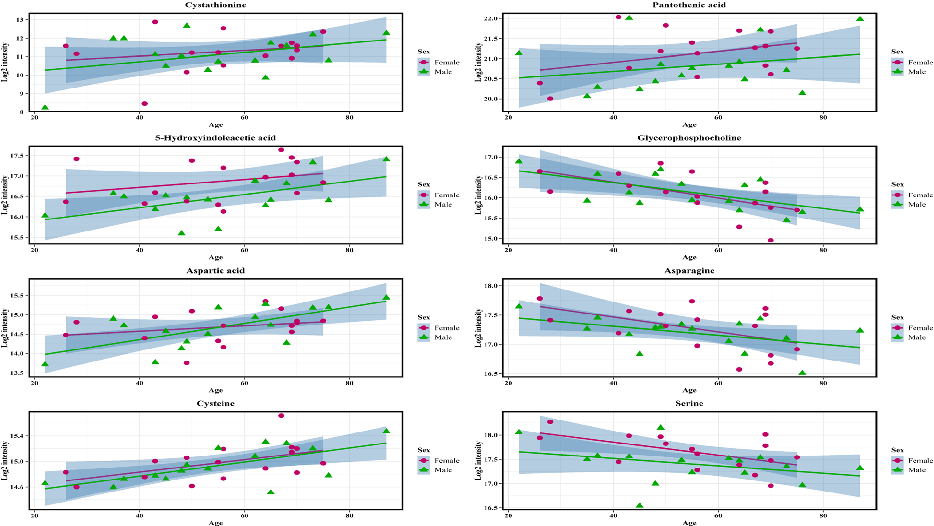
Scatter plots of individual metabolite abundance versus age reveal significant correlations for specific compounds, suggesting continuous metabolic drift across the lifespan.
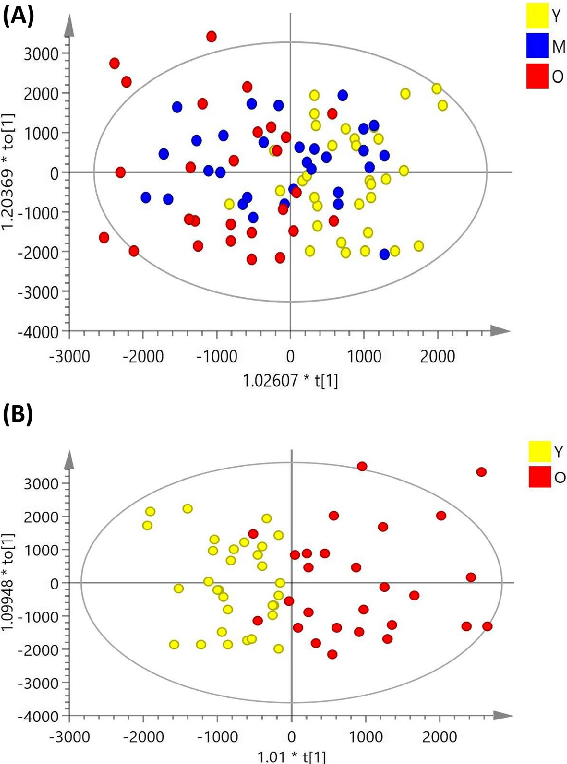
Exploring the aging process of cognitively healthy adults by analyzing cerebrospinal fluid …
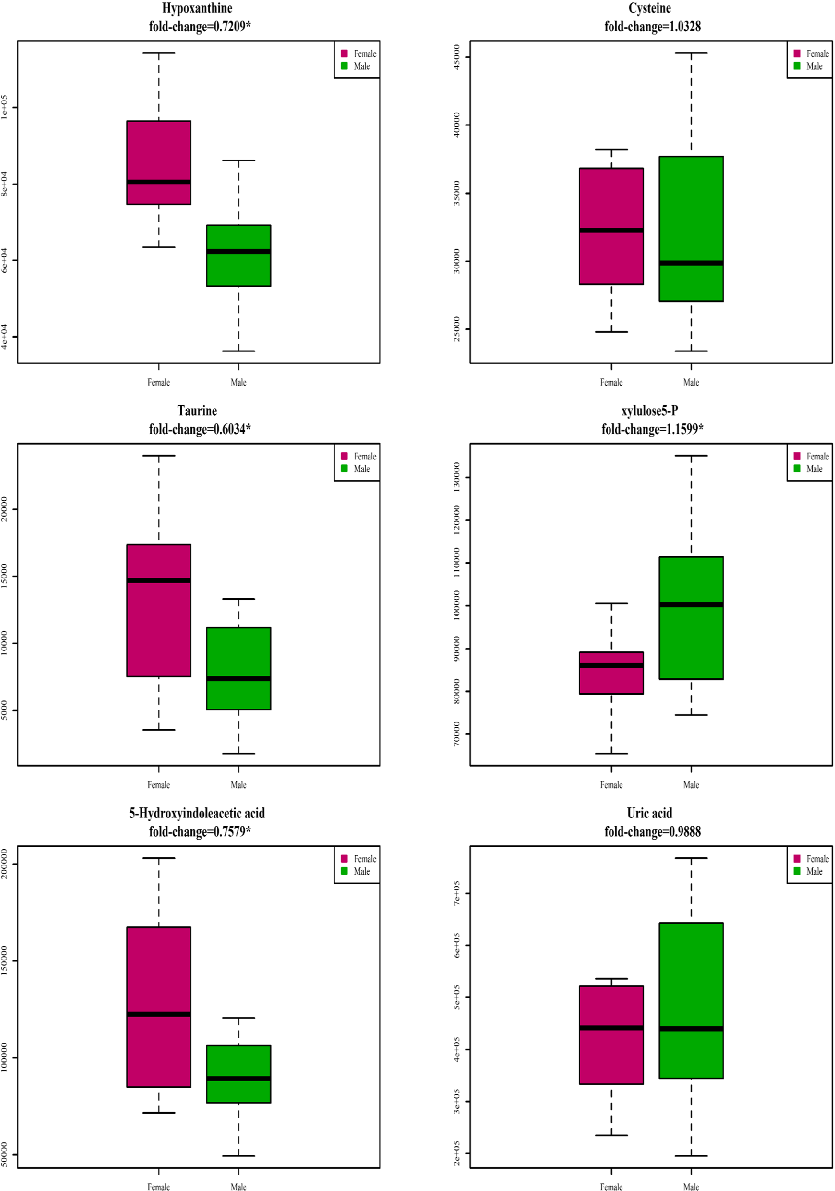
Sex-stratified metabolite-age correlation analysis in cerebrospinal fluid shows both shared and sex-specific metabolic aging patterns.
Exploring the aging process of cognitively healthy adults by analyzing cerebrospinal fluid …
Pathway enrichment analysis of age-associated CSF metabolites identifies disrupted metabolic pathways, including amino acid and lipid metabolism, during brain aging.
Exploring the aging process of cognitively healthy adults by analyzing cerebrospinal fluid …
Receiver operating characteristic curves evaluate the discriminative ability of selected CSF metabolites to distinguish older from younger cognitively healthy adults.
Exploring the aging process of cognitively healthy adults by analyzing cerebrospinal fluid …
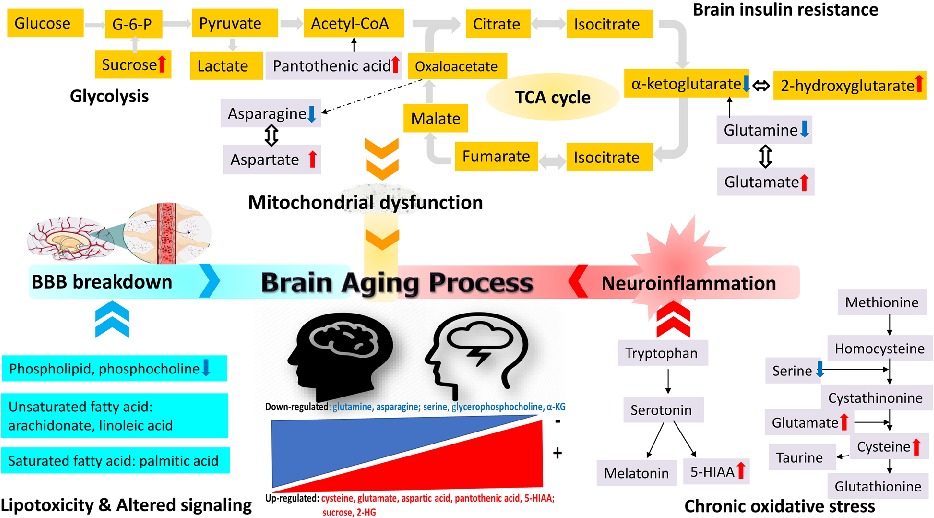
A schematic diagram summarizes the profiled CSF metabolite changes during brain aging, linking age-related metabolic shifts to neurodegeneration risk pathways.
Exploring the aging process of cognitively healthy adults by analyzing cerebrospinal fluid …
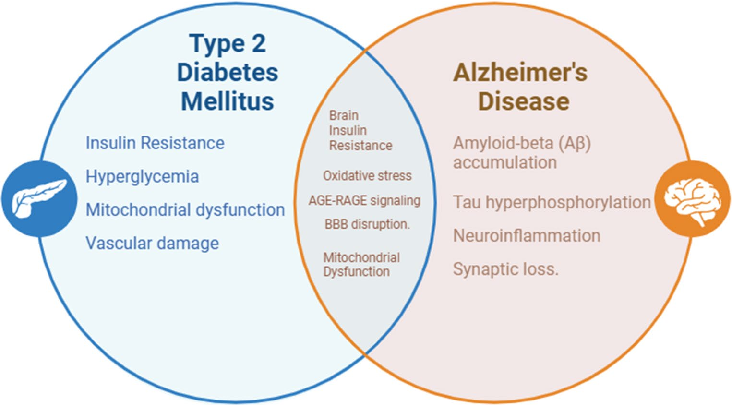
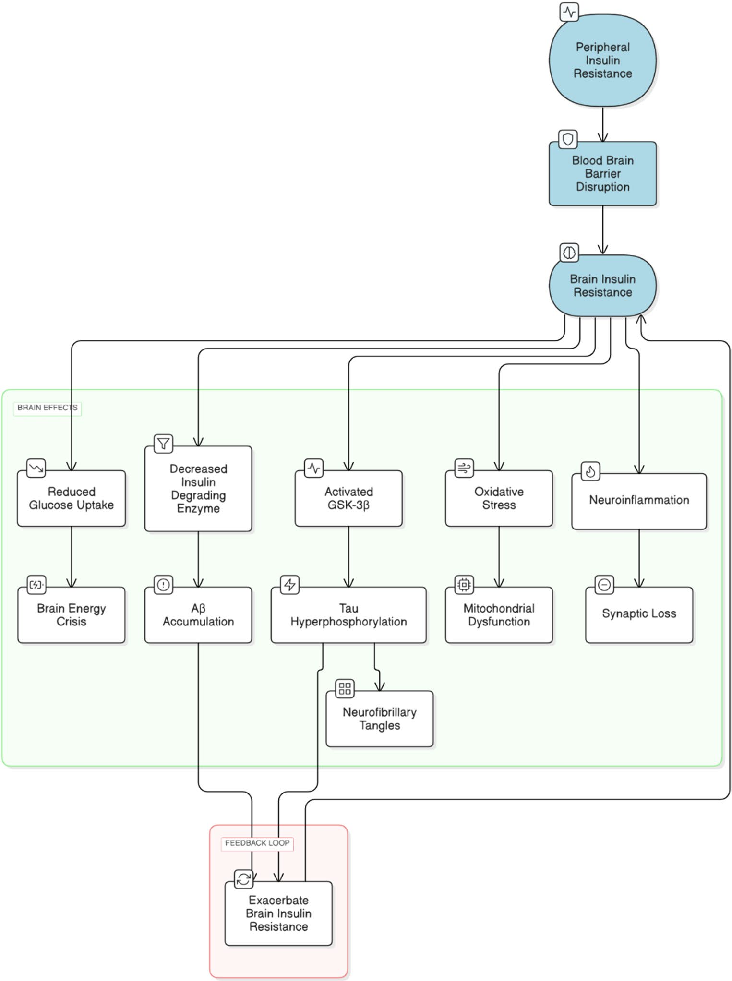
Experimental results examining from metabolic dysregulation to neurodegenerative pathology, with data points illustrating key findings related to type 2 Diabetes (T2D) and Alzheimer's Disease (AD) share common risk factors that can be seen through T2D nearly doub.
From metabolic dysregulation to neurodegenerative pathology: the role of hyperglycemia, oxidative stress, …
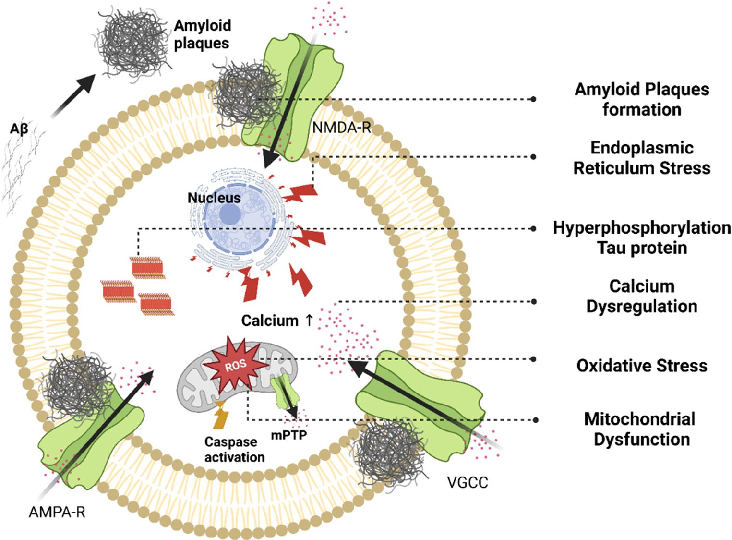
Statistical analysis from research investigating from metabolic dysregulation to neurodegenerative pathology, comparing treatment groups and control conditions.
From metabolic dysregulation to neurodegenerative pathology: the role of hyperglycemia, oxidative stress, …
Measured parameters from a study evaluating from metabolic dysregulation to neurodegenerative pathology, contributing to the overall assessment of type 2 Diabetes (T2D) and Alzheimer's Disease (AD) share common risk factors that can be seen through T2D nearly doub.
From metabolic dysregulation to neurodegenerative pathology: the role of hyperglycemia, oxidative stress, …
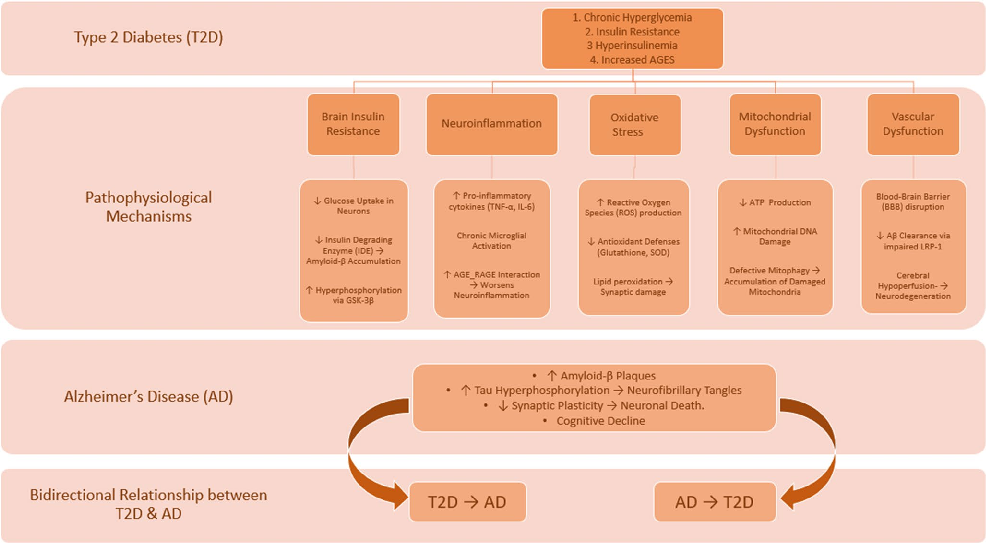
Graphical representation of outcomes in a study of from metabolic dysregulation to neurodegenerative pathology, highlighting trends observed across experimental conditions.
From metabolic dysregulation to neurodegenerative pathology: the role of hyperglycemia, oxidative stress, …