Ginkgo biloba Figures
13 figures issues de recherches évaluées par des pairs
Alpha diversity analysis of gut microbiota in Alzheimer's model mice treated with Ginkgo biloba extract. Shannon and Simpson diversity indices indicate shifts in microbial community richness and evenness following treatment.
Ginkgo biloba Extract Drives Gut Flora and Microbial Metabolism Variation in a …
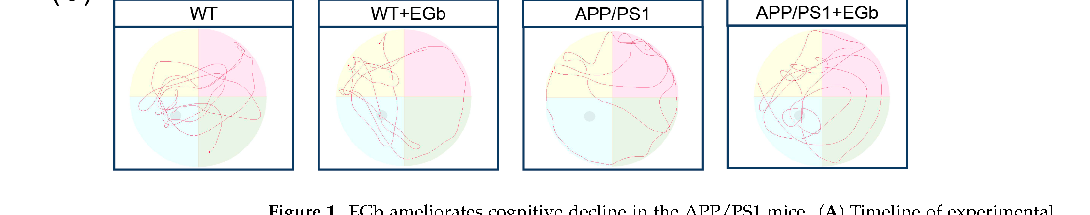
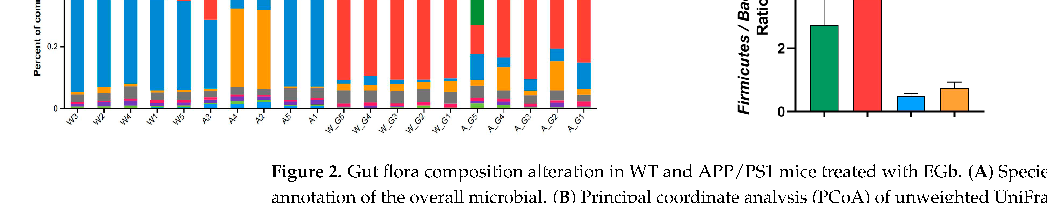
Beta diversity analysis using principal coordinate plots to compare gut microbial community structures across treatment groups. Distinct clustering patterns suggest Ginkgo biloba extract alters the overall composition of the gut microbiome in Alzheimer's model mice.
Ginkgo biloba Extract Drives Gut Flora and Microbial Metabolism Variation in a …
Taxonomic composition of gut microbiota at the phylum level across experimental groups. Relative abundance of Firmicutes, Bacteroidetes, and other phyla is compared between Ginkgo biloba-treated and control Alzheimer's model mice.
Ginkgo biloba Extract Drives Gut Flora and Microbial Metabolism Variation in a …
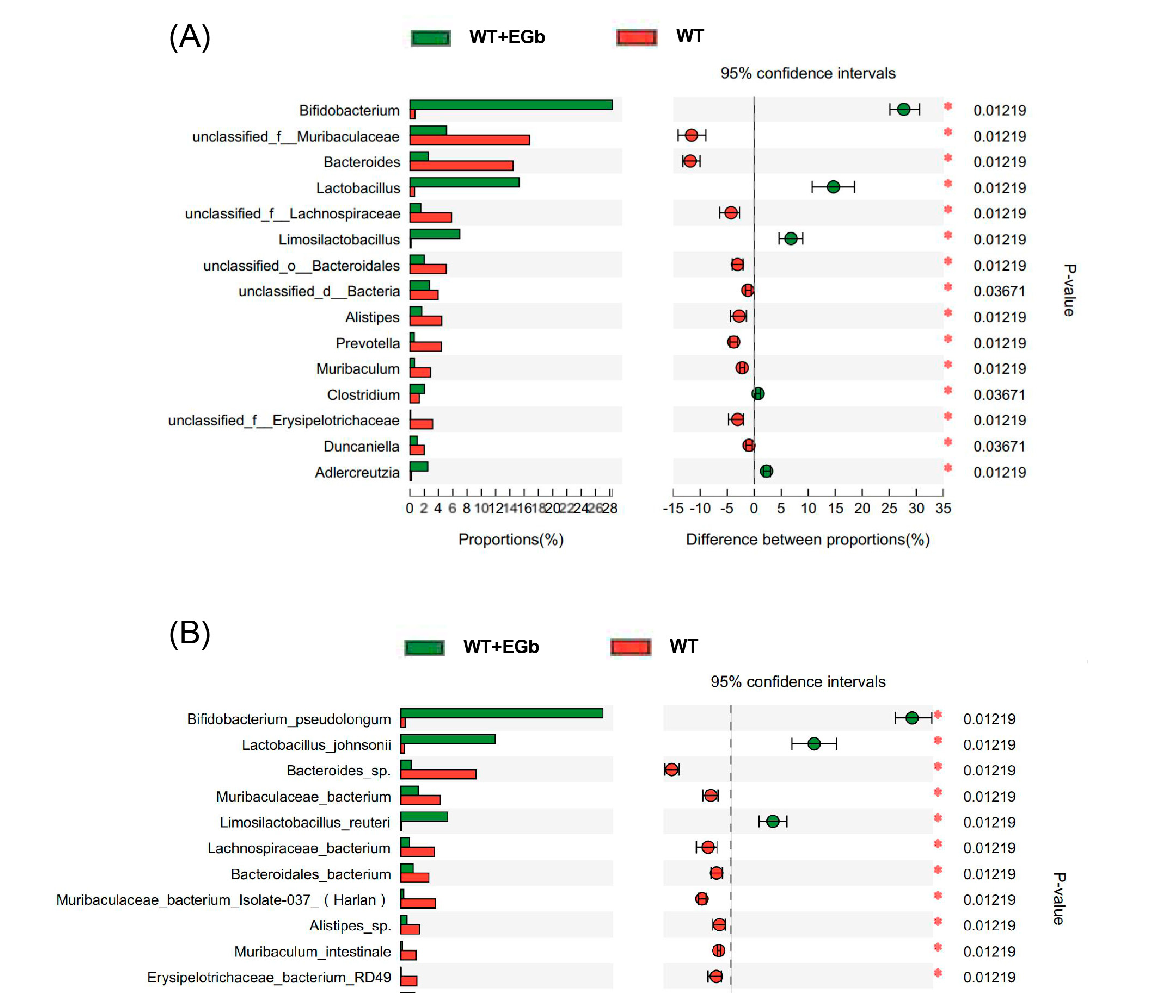
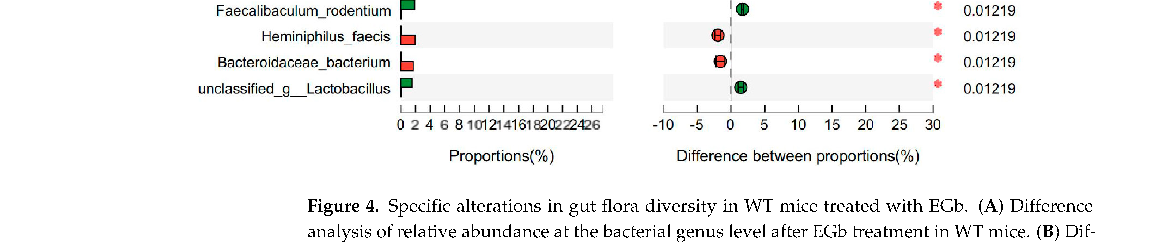
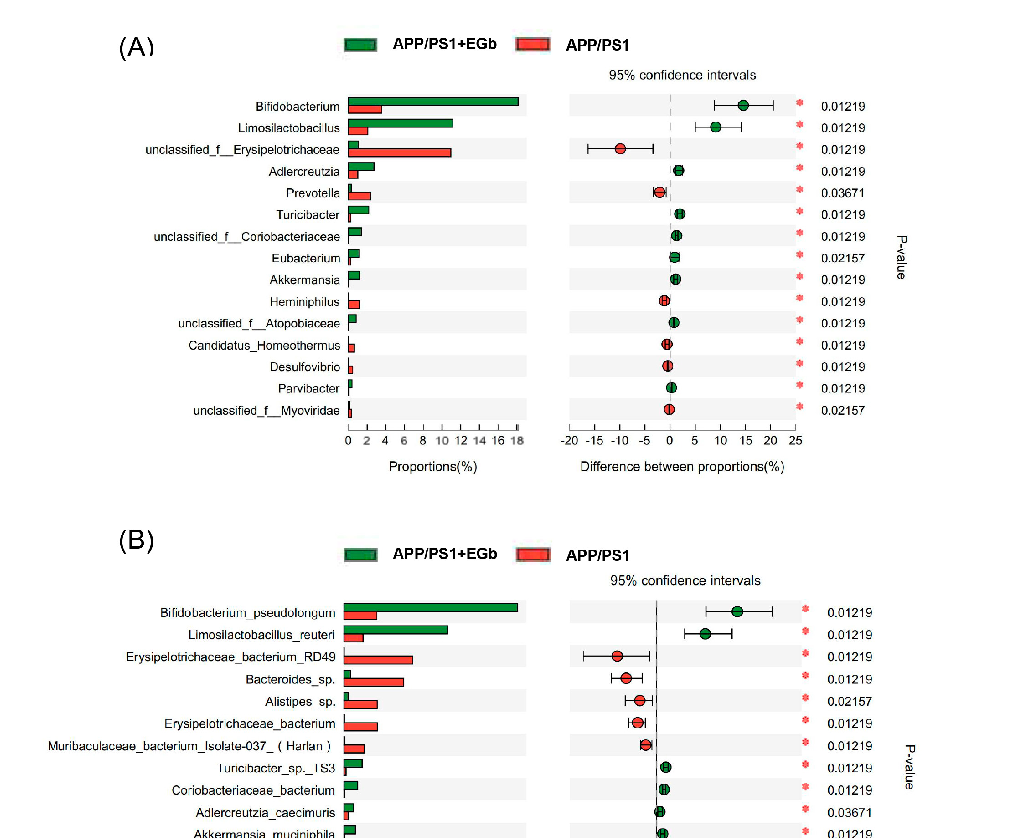
Genus-level taxonomic analysis of gut flora showing differential abundance of specific bacterial genera in response to Ginkgo biloba extract treatment. Several genera associated with short-chain fatty acid production appear enriched in the treatment group.
Ginkgo biloba Extract Drives Gut Flora and Microbial Metabolism Variation in a …
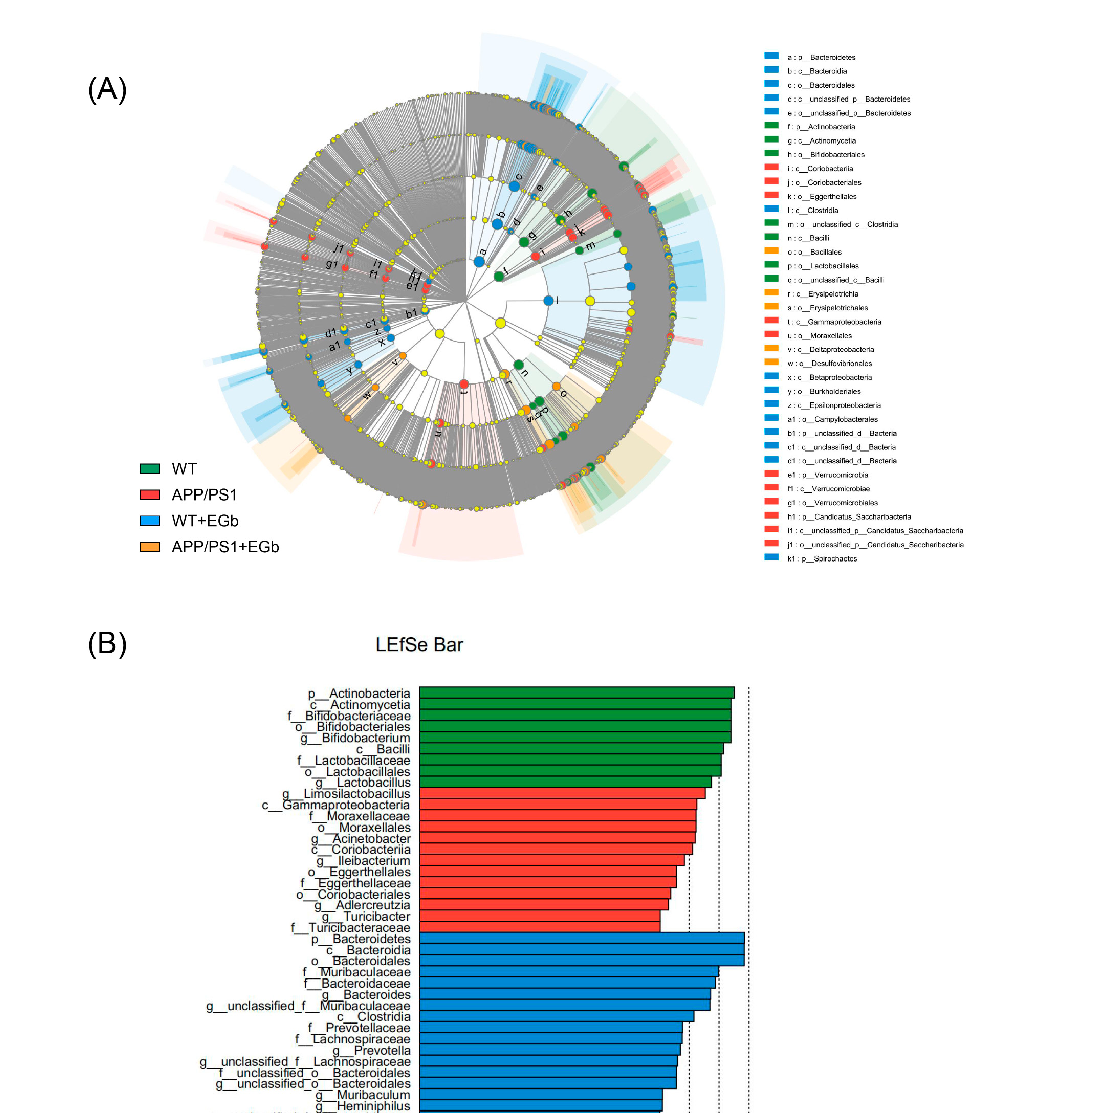
LEfSe analysis identifying microbial biomarkers that distinguish Ginkgo biloba-treated mice from controls. Discriminant taxa are ranked by effect size, revealing key bacterial groups responsive to treatment.
Ginkgo biloba Extract Drives Gut Flora and Microbial Metabolism Variation in a …
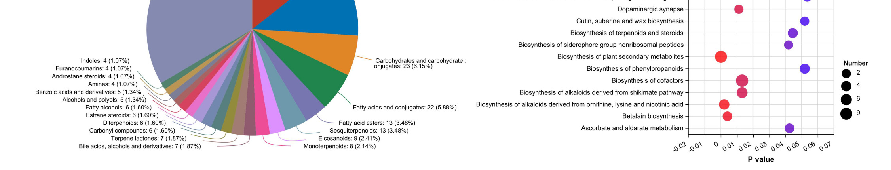
Functional prediction analysis of gut microbial metabolic pathways using PICRUSt or similar tools. Metabolic categories enriched in Ginkgo biloba-treated Alzheimer's model mice suggest alterations in amino acid metabolism, lipid metabolism, and neurotransmitter-related pathways.
Ginkgo biloba Extract Drives Gut Flora and Microbial Metabolism Variation in a …
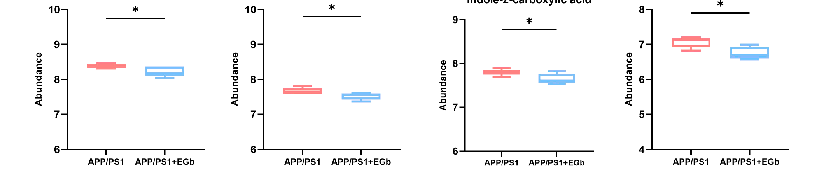
Statistical comparison of specific microbial metabolites or pathway abundances between treatment groups, with significance indicated (*p < 0.05). Differential metabolic activity in the gut microbiome may be associated with the neuroprotective effects observed in the Ginkgo biloba group.
Ginkgo biloba Extract Drives Gut Flora and Microbial Metabolism Variation in a …
Correlation analysis between gut microbiota composition and behavioral or neurological markers in Alzheimer's model mice. Spearman or Pearson correlation heatmaps reveal associations between specific bacterial genera and cognitive performance metrics.
Ginkgo biloba Extract Drives Gut Flora and Microbial Metabolism Variation in a …
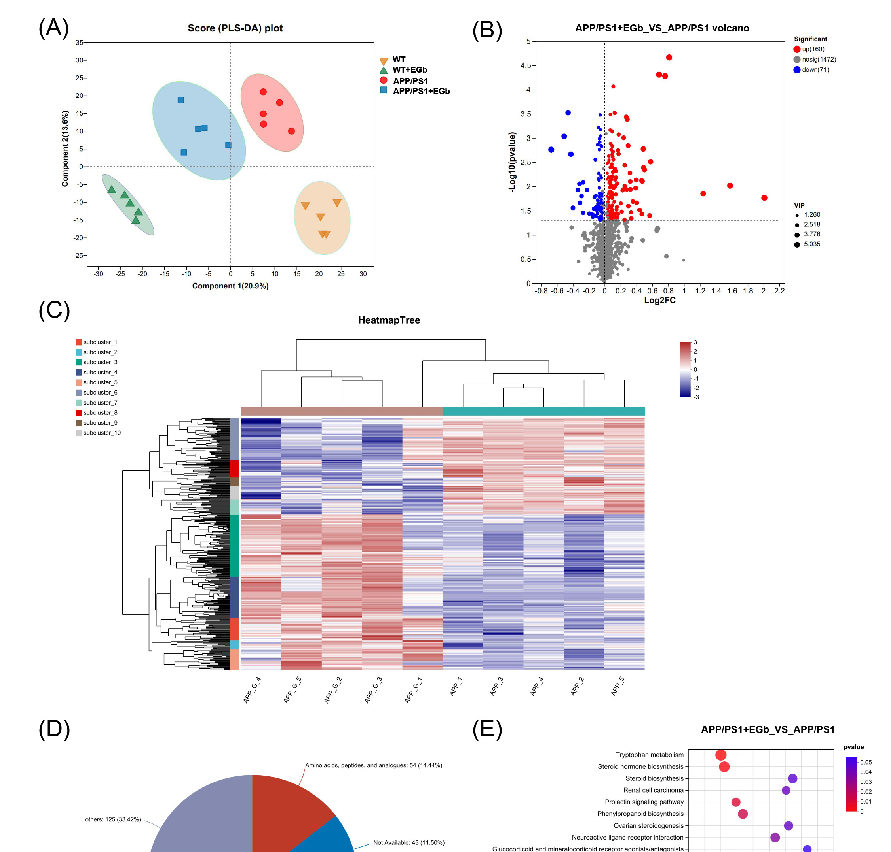
Metabolomic profiling of cecal or fecal contents comparing Ginkgo biloba-treated and control groups. OPLS-DA or PCA score plots demonstrate separation of metabolic profiles between treatment conditions.
Ginkgo biloba Extract Drives Gut Flora and Microbial Metabolism Variation in a …
Volcano plot or heatmap of differentially abundant metabolites identified in the gut of Ginkgo biloba-treated Alzheimer's model mice. Metabolites related to tryptophan, bile acid, and short-chain fatty acid pathways are highlighted.
Ginkgo biloba Extract Drives Gut Flora and Microbial Metabolism Variation in a …

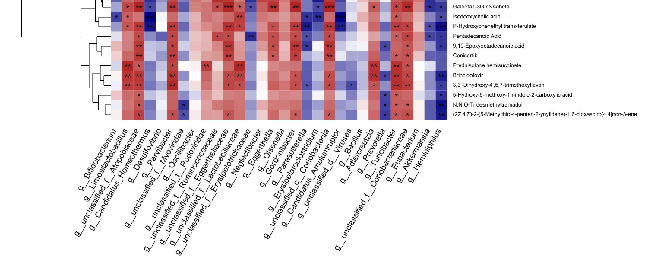
Correlation matrix between differentially abundant gut metabolites and specific bacterial genera altered by Ginkgo biloba treatment. Strong associations suggest mechanistic links between microbial metabolism and the brain-gut axis in Alzheimer's disease.
Ginkgo biloba Extract Drives Gut Flora and Microbial Metabolism Variation in a …
Serum or plasma biomarker analysis comparing inflammatory cytokine levels between Ginkgo biloba-treated and control Alzheimer's model mice. Markers such as IL-6, TNF-alpha, and IL-1beta are quantified.
Ginkgo biloba Extract Drives Gut Flora and Microbial Metabolism Variation in a …
Quantification of gut permeability markers or short-chain fatty acid concentrations in fecal samples from experimental groups. Butyrate, propionate, and acetate levels are compared to assess the metabolic impact of Ginkgo biloba on the gut environment.
Ginkgo biloba Extract Drives Gut Flora and Microbial Metabolism Variation in a …