विवरण
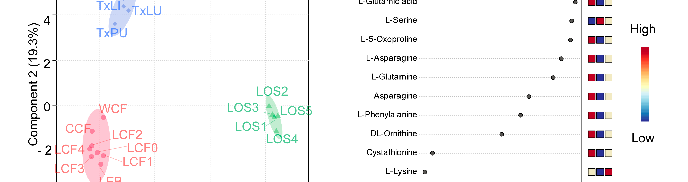
Graphical representation of outcomes in a study of stage, highlighting trends observed across experimental conditions.
More Figures from This Paper
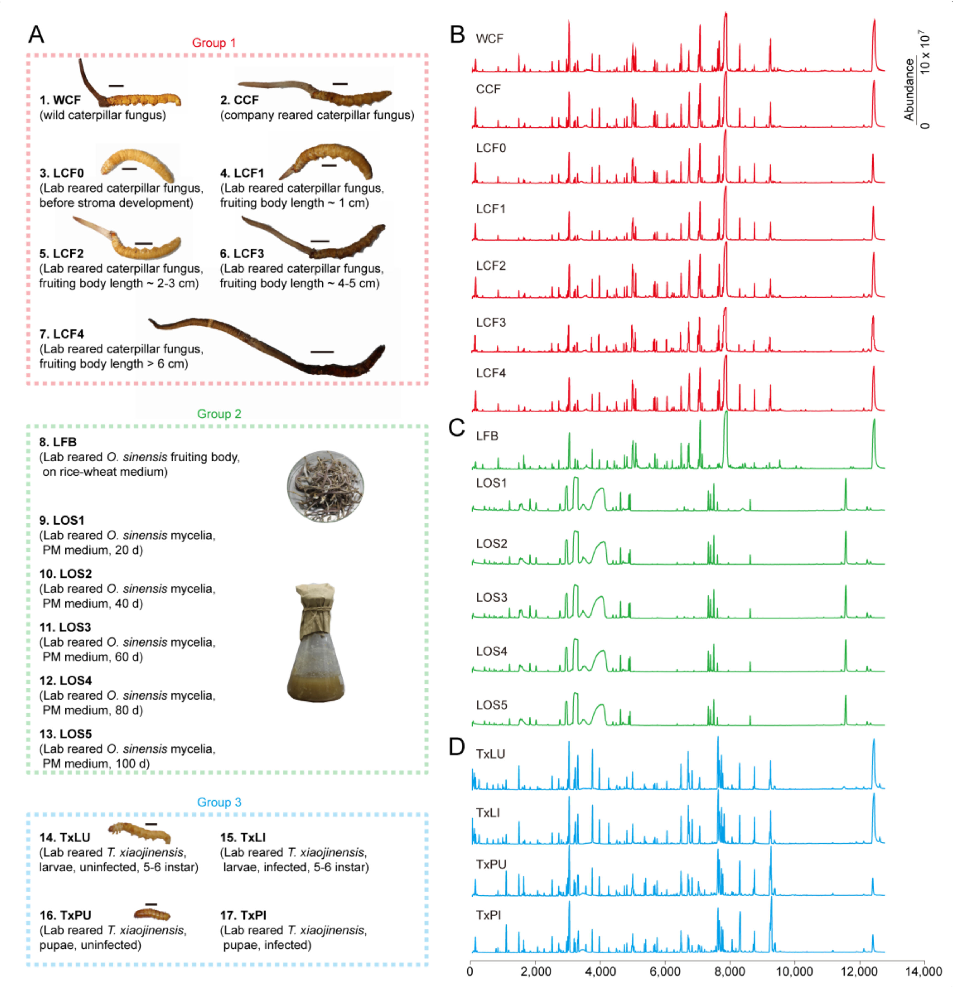
Figure 6
Experimental results examining stage, with data points illustrating key findings related to cordyceps, a parasitic complex of the fungus Ophiocordyceps sinensis (Berk.) (Hypocreales: Ophiocordycipitaceae) and .
chart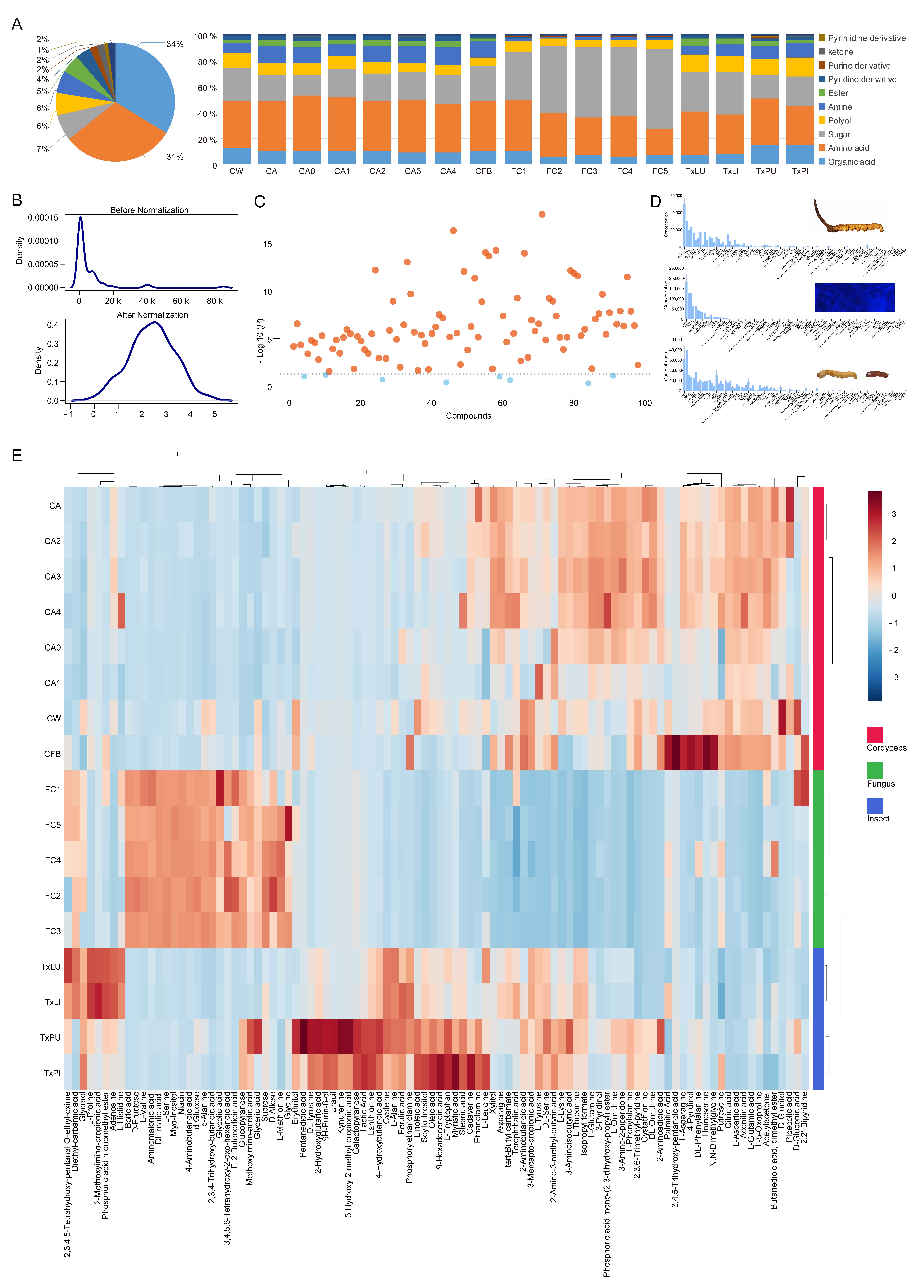
Figure 7
Statistical analysis from research investigating stage, comparing treatment groups and control conditions.
chart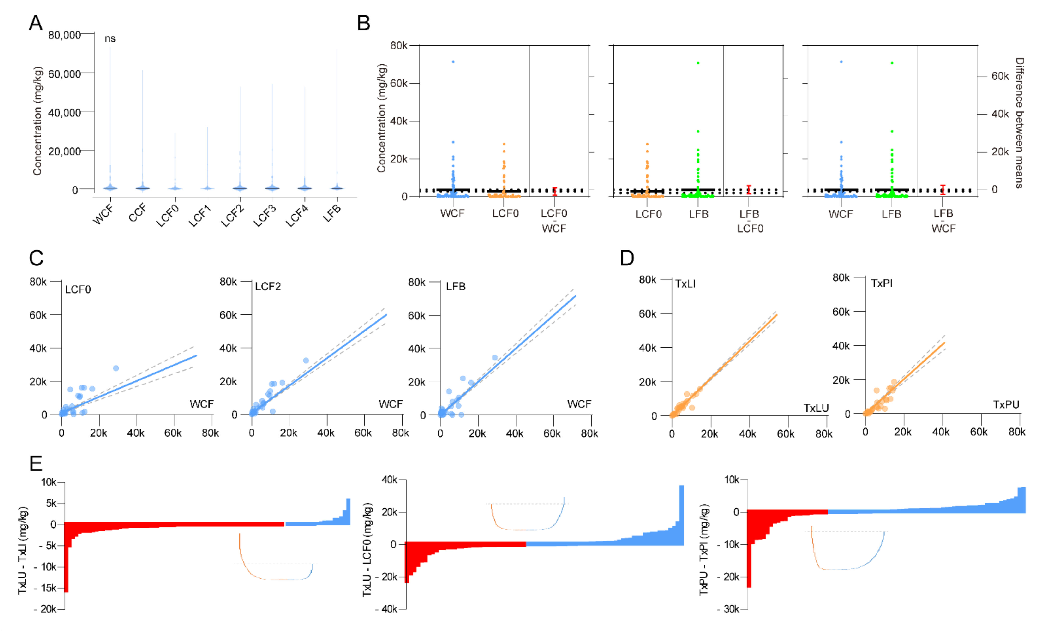
Figure 8
LCF0 were sucrose, glycerol, L-leucine, L-histidine and L-tyrosine, compared to uninfected larvae (Figure 3E).
chart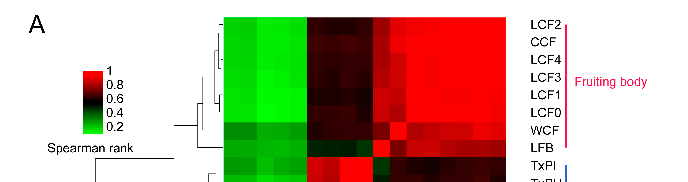
Figure 9
Graphical representation of outcomes in a study of stage, highlighting trends observed across experimental conditions.
chart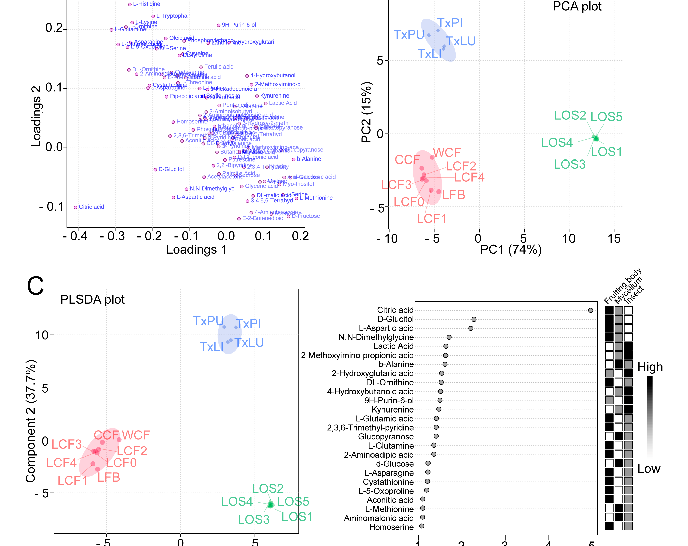
Figure 12
Statistical analysis from research investigating stage, comparing treatment groups and control conditions.
chart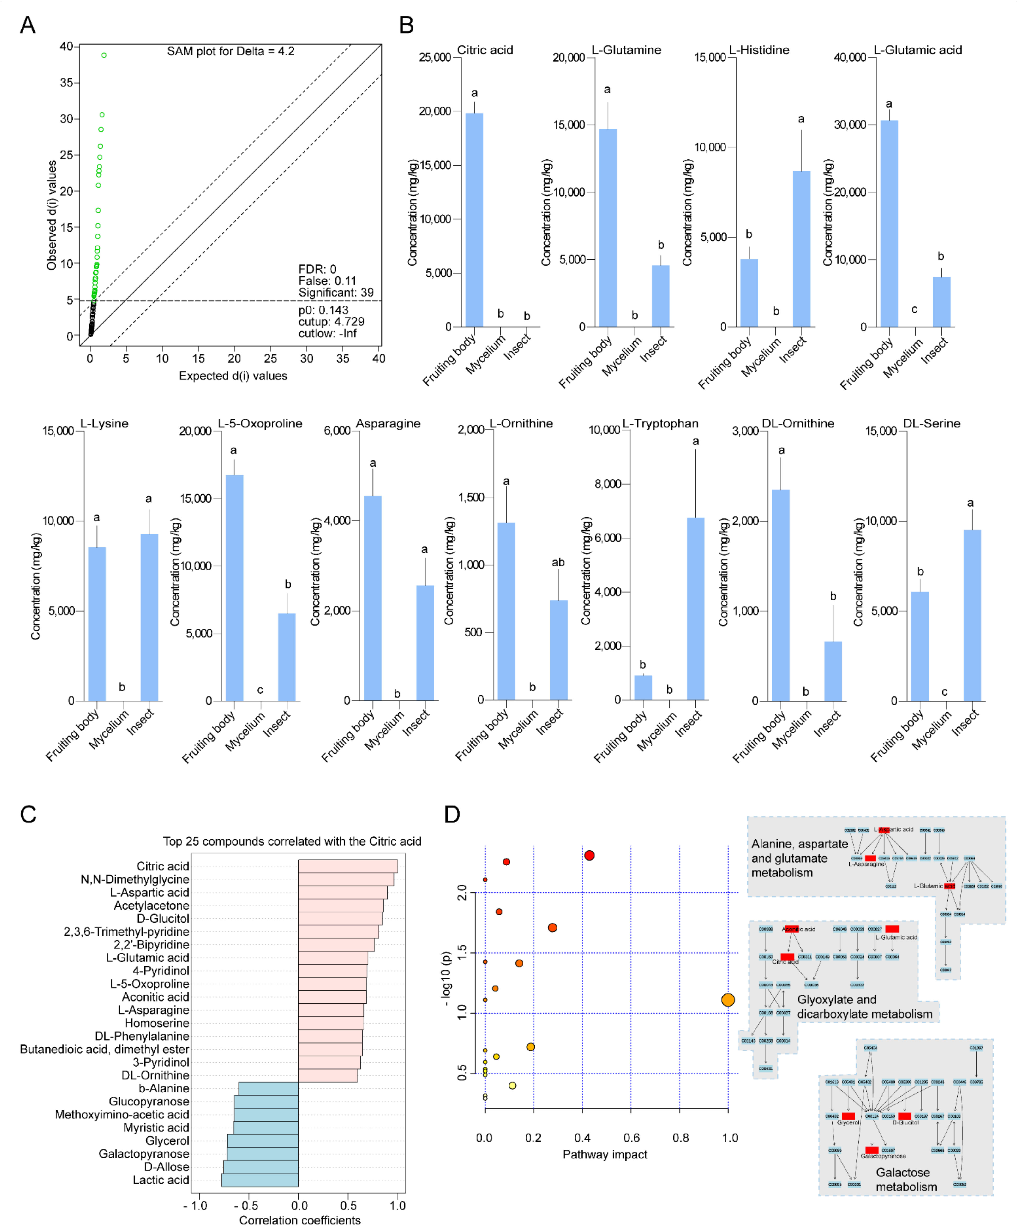
Figure 16
Experimental results examining stage, with data points illustrating key findings related to cordyceps, a parasitic complex of the fungus Ophiocordyceps sinensis (Berk.) (Hypocreales: Ophiocordycipitaceae) and .
chartFigure 14
ChartSource Paper
Stage- and Rearing-Dependent Metabolomics Profiling of Ophiocordyceps sinensis and Its Pipeline Products.Cite This Figure
 > Source: Rui Tang et al. "Stage- and Rearing-Dependent Metabolomics Profiling of Ophiocordyceps sinensis a." *Insects*, 2021. PMID: [34442232](https://pubmed.ncbi.nlm.nih.gov/34442232/)
<figure>
  <img src="https://pdfs.citedhealth.com/figures/34442232/131.png" alt="Graphical representation of outcomes in a study of stage, highlighting trends observed across experimental conditions." />
  <figcaption>Figure 14. Graphical representation of outcomes in a study of stage, highlighting trends observed across experimental conditions.<br>  Source: Rui Tang et al. "Stage- and Rearing-Dependent Metabolomics Profiling of Ophiocordyceps sinensis a." <em>Insects</em>, 2021. PMID: <a href="https://pubmed.ncbi.nlm.nih.gov/34442232/">34442232</a></figcaption>
</figure>