Исследовательский процесс
368 иллюстрации из рецензируемых исследований
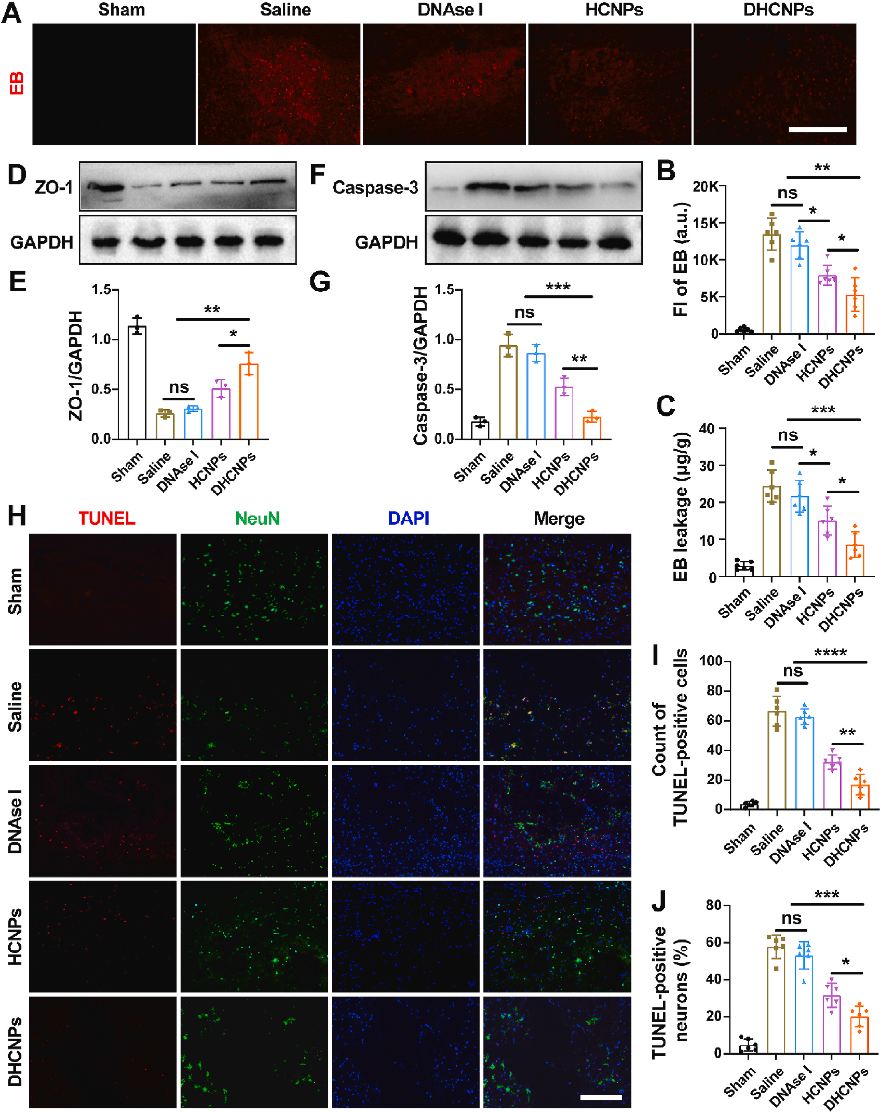
A biomimic anti-neuroinflammatory nanoplatform for active neutrophil extracellular traps targeting and spinal …
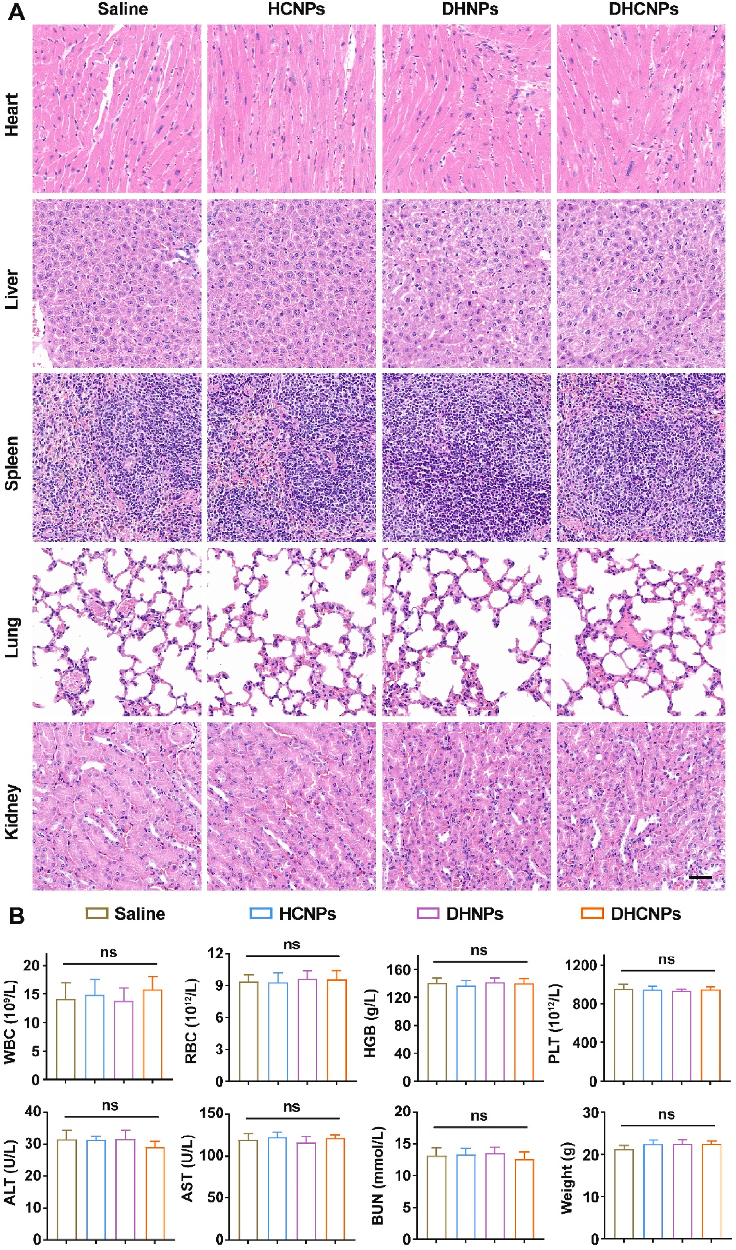
A biomimic anti-neuroinflammatory nanoplatform for active neutrophil extracellular traps targeting and spinal …
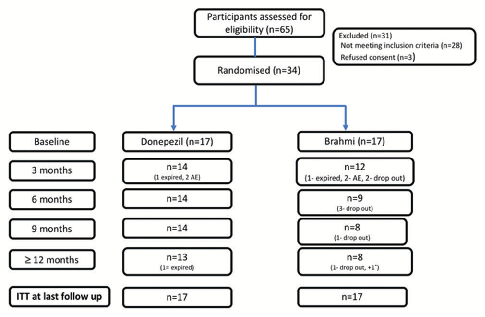
Efficacy of Bacopa Monnieri (Brahmi) and Donepezil in Alzheimer's Disease and Mild …
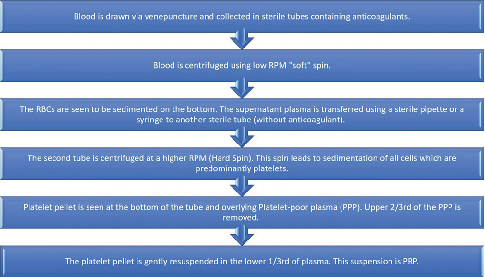
Figure 1: Step-by-step flow diagram of preparation of platelet-rich plasma using open double-spin method
Platelet-Rich Plasma in Androgenetic Alopecia.
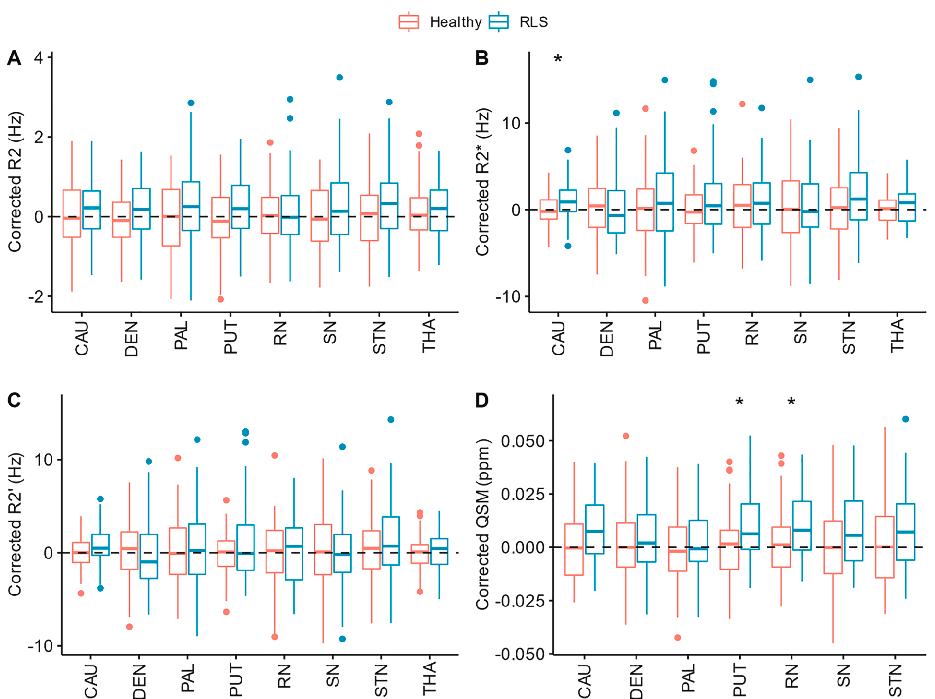
Fig. 1. Regional (A) R2, (B) R2*, (C) R2′ and (D) QSM values corrected for age and volume for healthy controls (blue) and RLS patients (red). CAU: Caudate, DEN: Dentate …
Revisiting brain iron deficiency in restless legs syndrome using magnetic resonance imaging.
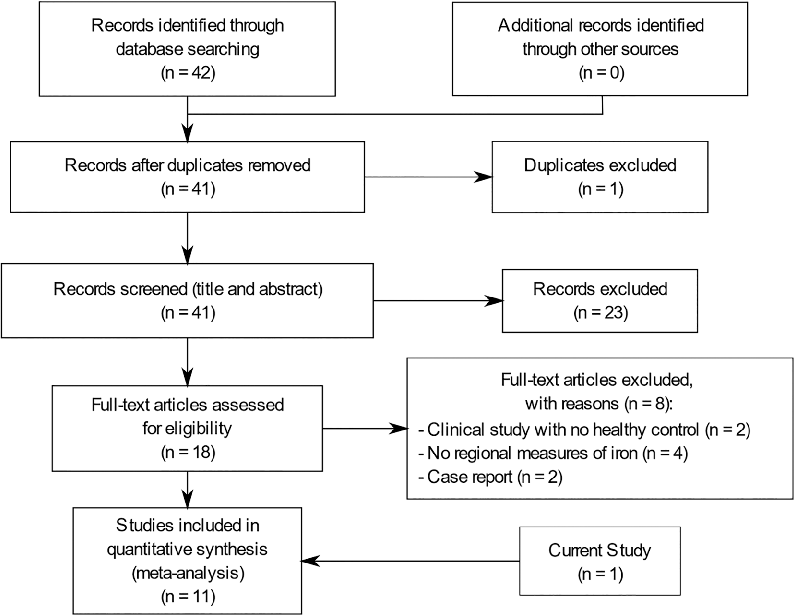
Fig. 2. Flow Diagram of the systematic search for MRI studies of iron in RLS.
Revisiting brain iron deficiency in restless legs syndrome using magnetic resonance imaging.
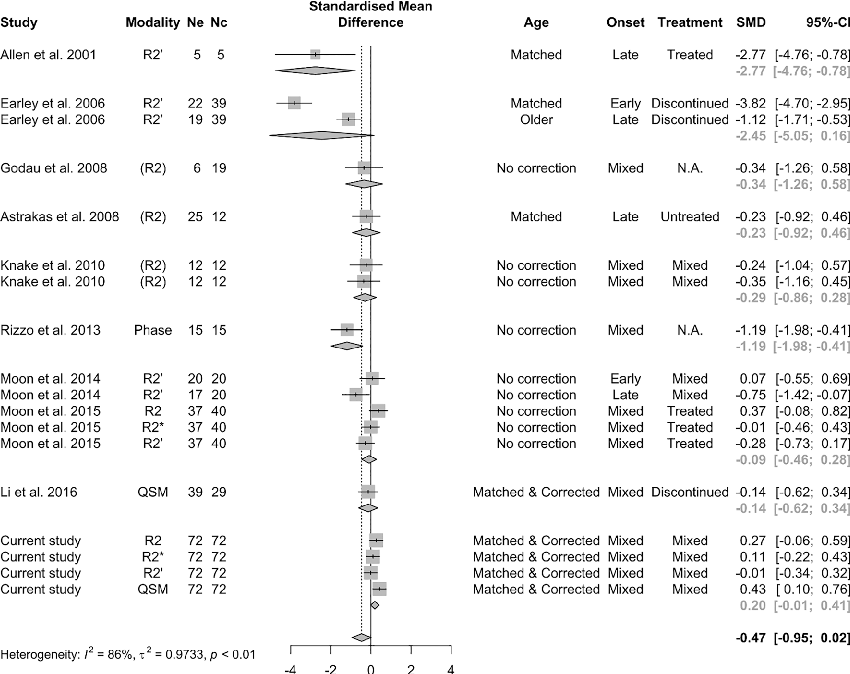
Revisiting brain iron deficiency in restless legs syndrome using magnetic resonance imaging.
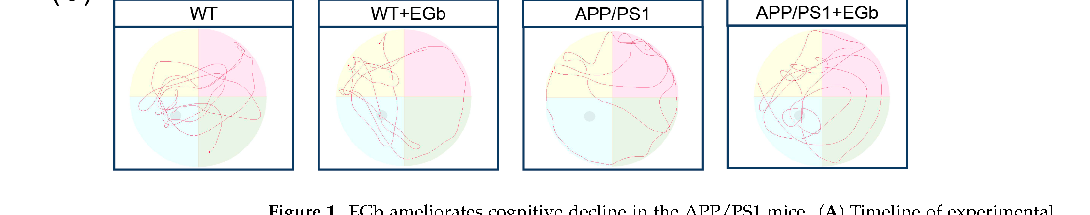
Alpha diversity analysis of gut microbiota in Alzheimer's model mice treated with Ginkgo biloba extract. Shannon and Simpson diversity indices indicate shifts in microbial community richness and evenness following treatment.
Ginkgo biloba Extract Drives Gut Flora and Microbial Metabolism Variation in a …
Beta diversity analysis using principal coordinate plots to compare gut microbial community structures across treatment groups. Distinct clustering patterns suggest Ginkgo biloba extract alters the overall composition of the gut microbiome in Alzheimer's model mice.
Ginkgo biloba Extract Drives Gut Flora and Microbial Metabolism Variation in a …
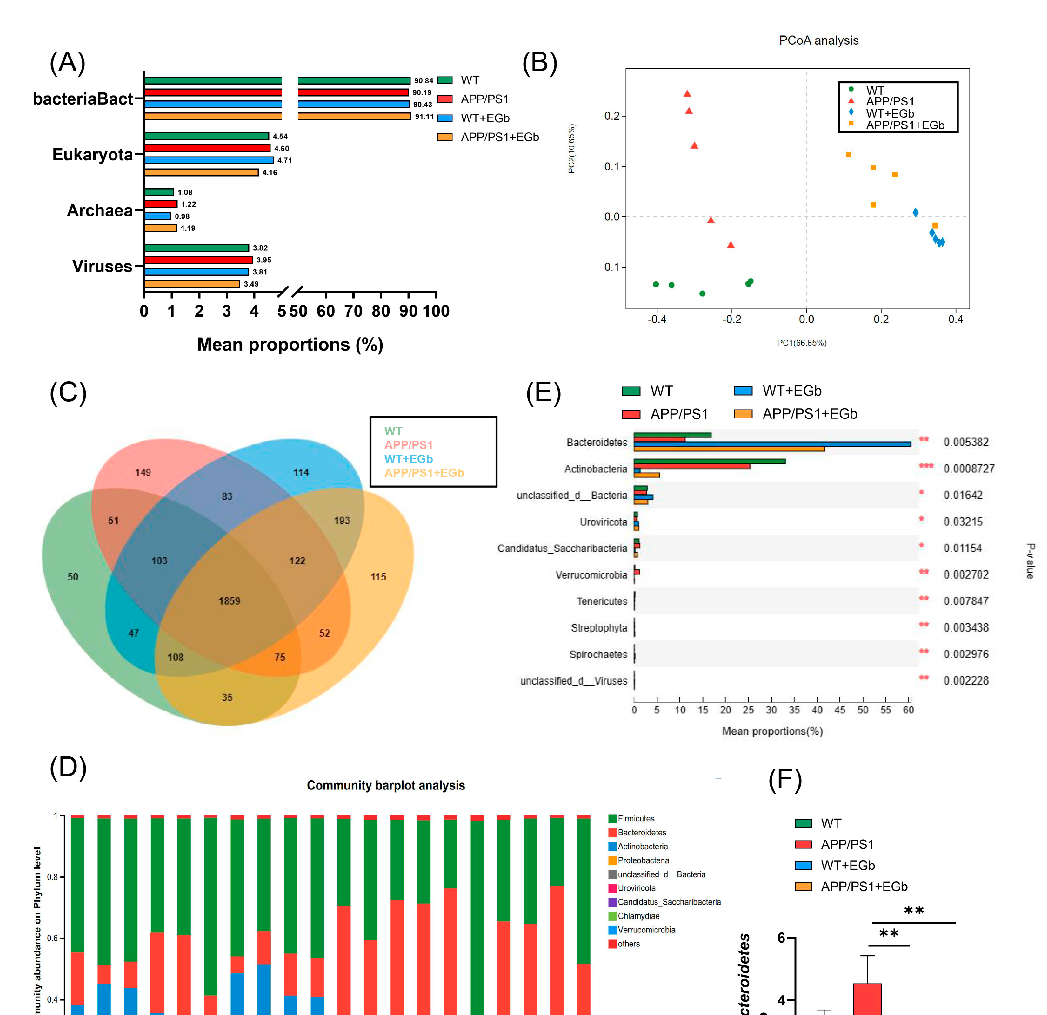
Taxonomic composition of gut microbiota at the phylum level across experimental groups. Relative abundance of Firmicutes, Bacteroidetes, and other phyla is compared between Ginkgo biloba-treated and control Alzheimer's model mice.
Ginkgo biloba Extract Drives Gut Flora and Microbial Metabolism Variation in a …
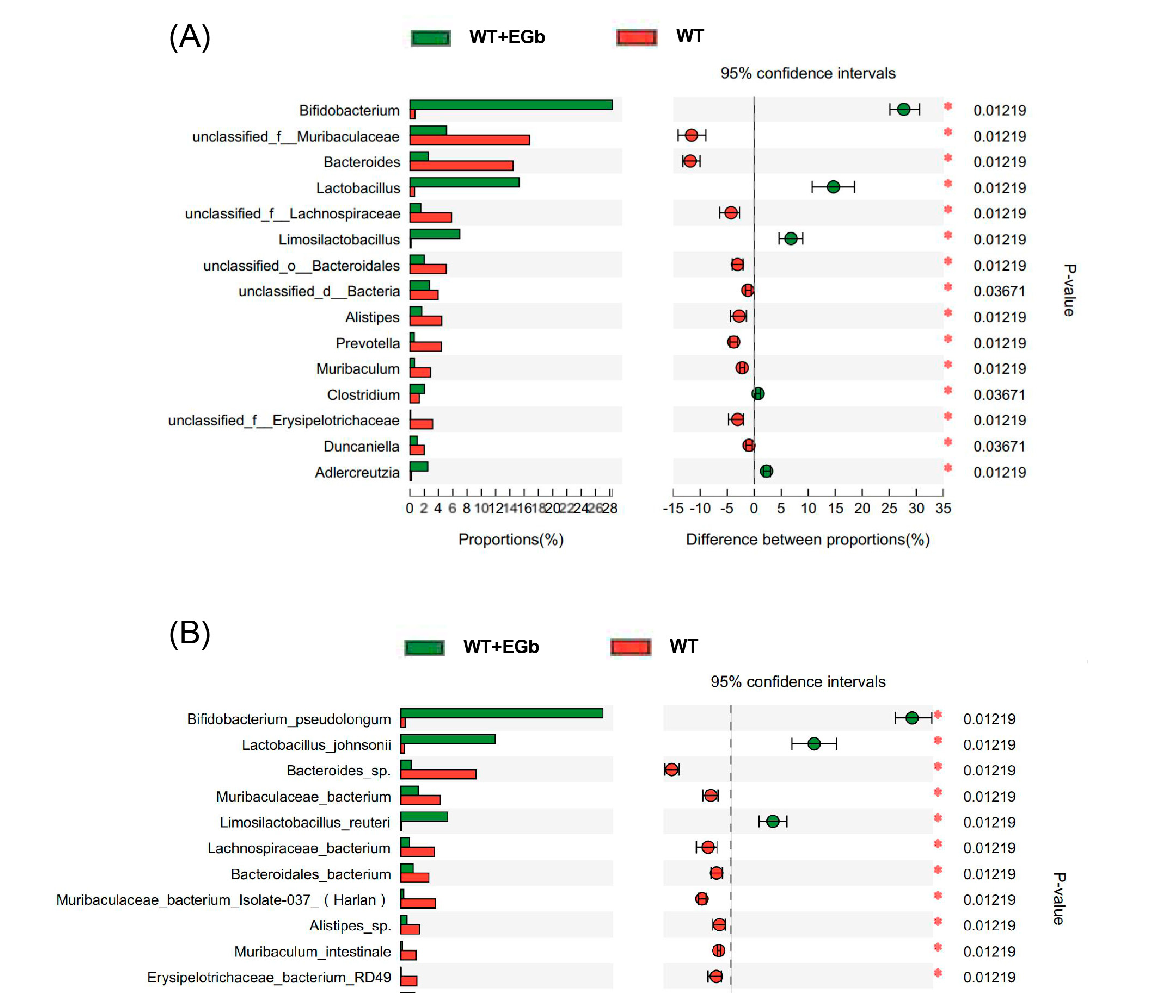
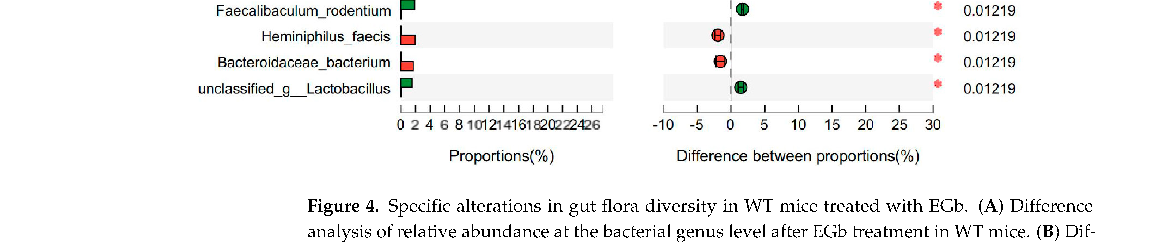
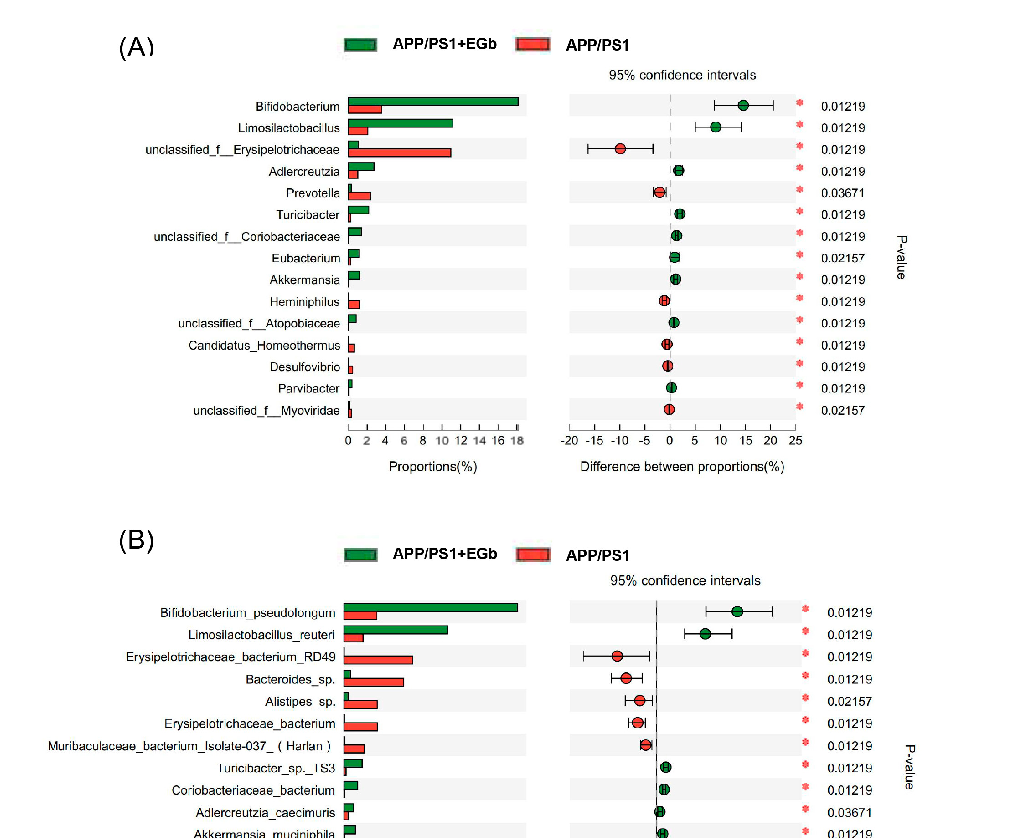
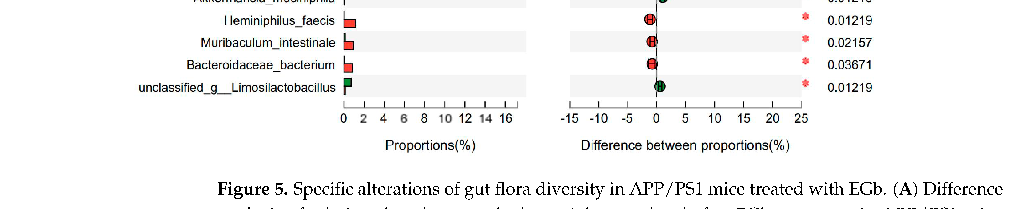
Genus-level taxonomic analysis of gut flora showing differential abundance of specific bacterial genera in response to Ginkgo biloba extract treatment. Several genera associated with short-chain fatty acid production appear enriched in the treatment group.
Ginkgo biloba Extract Drives Gut Flora and Microbial Metabolism Variation in a …
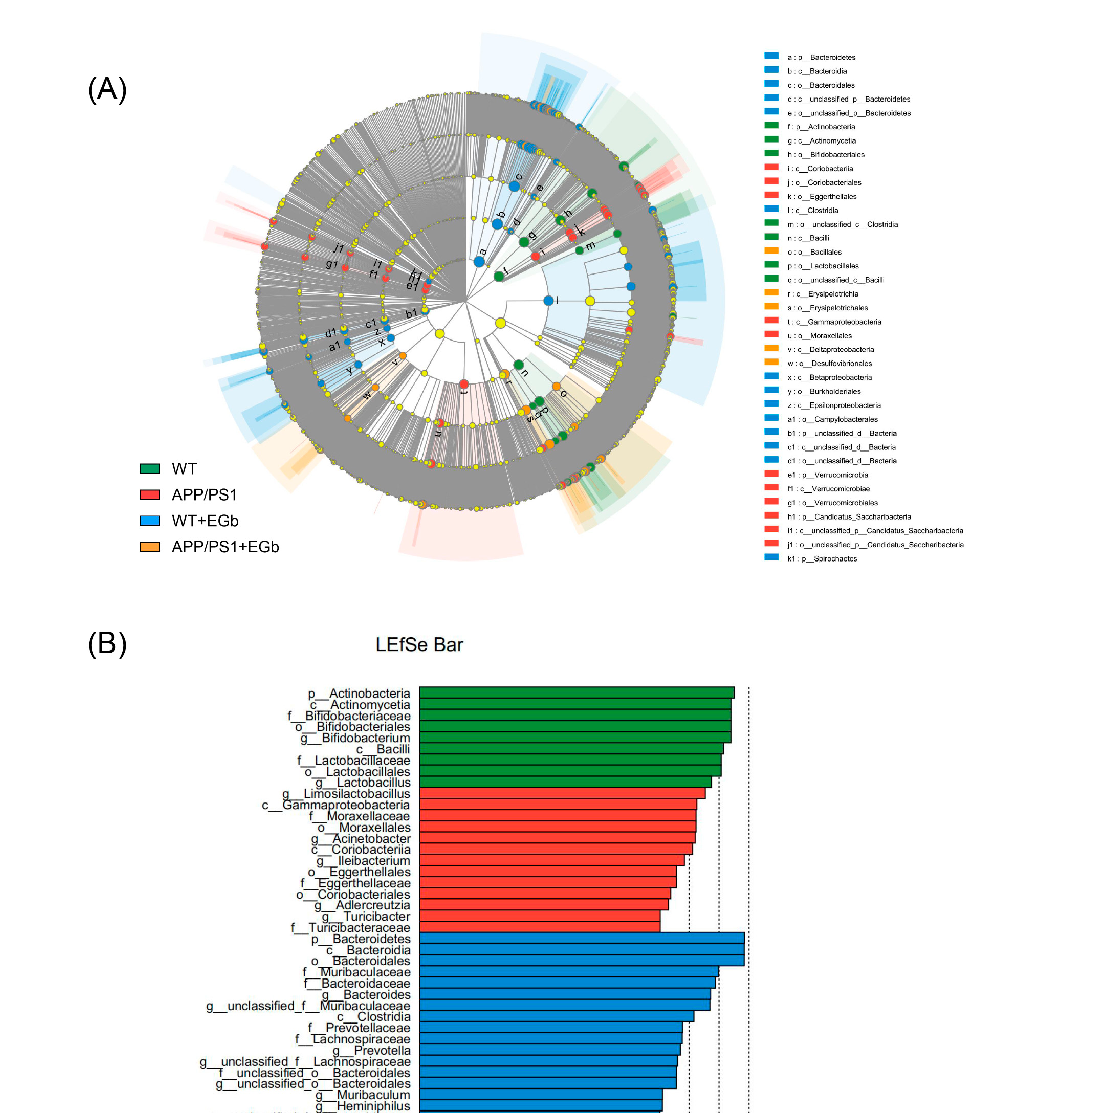
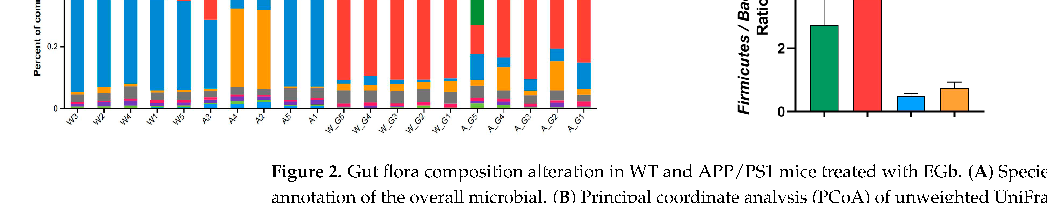
LEfSe analysis identifying microbial biomarkers that distinguish Ginkgo biloba-treated mice from controls. Discriminant taxa are ranked by effect size, revealing key bacterial groups responsive to treatment.
Ginkgo biloba Extract Drives Gut Flora and Microbial Metabolism Variation in a …

Cladogram visualization of microbial taxa significantly associated with Ginkgo biloba extract treatment. Hierarchical taxonomic relationships from phylum to genus level highlight lineages that are differentially abundant between groups.
Ginkgo biloba Extract Drives Gut Flora and Microbial Metabolism Variation in a …
Functional prediction analysis of gut microbial metabolic pathways using PICRUSt or similar tools. Metabolic categories enriched in Ginkgo biloba-treated Alzheimer's model mice suggest alterations in amino acid metabolism, lipid metabolism, and neurotransmitter-related pathways.
Ginkgo biloba Extract Drives Gut Flora and Microbial Metabolism Variation in a …
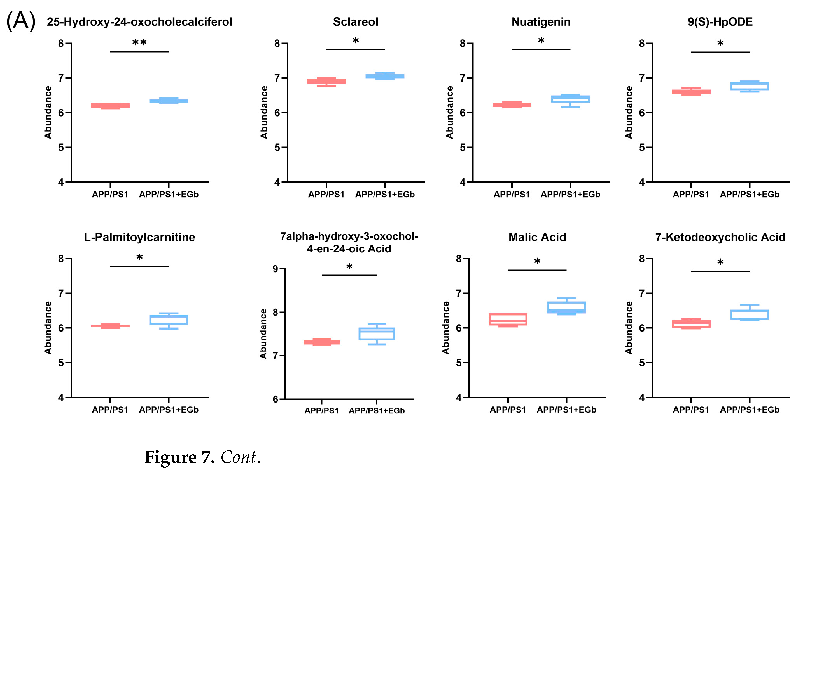
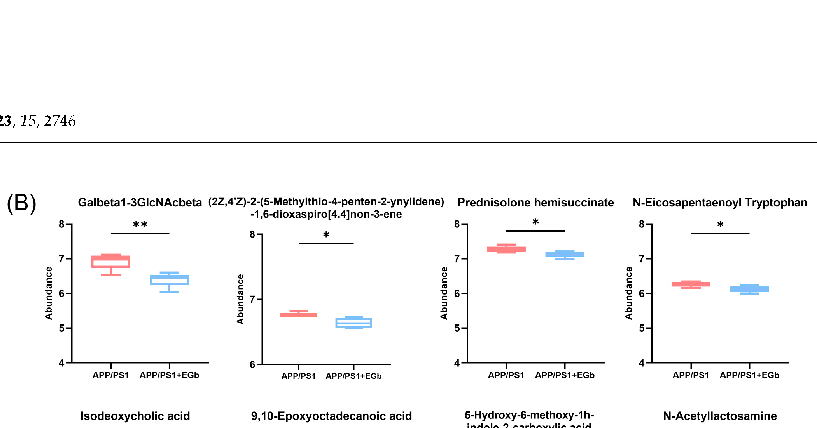
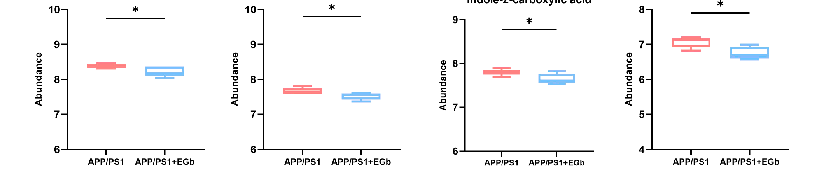
Statistical comparison of specific microbial metabolites or pathway abundances between treatment groups, with significance indicated (*p < 0.05). Differential metabolic activity in the gut microbiome may be associated with the neuroprotective effects observed in the Ginkgo biloba group.
Ginkgo biloba Extract Drives Gut Flora and Microbial Metabolism Variation in a …
Correlation analysis between gut microbiota composition and behavioral or neurological markers in Alzheimer's model mice. Spearman or Pearson correlation heatmaps reveal associations between specific bacterial genera and cognitive performance metrics.
Ginkgo biloba Extract Drives Gut Flora and Microbial Metabolism Variation in a …
Network analysis depicting co-occurrence patterns among gut microbial taxa in response to Ginkgo biloba treatment. Nodes represent bacterial genera and edges represent significant positive or negative correlations.
Ginkgo biloba Extract Drives Gut Flora and Microbial Metabolism Variation in a …
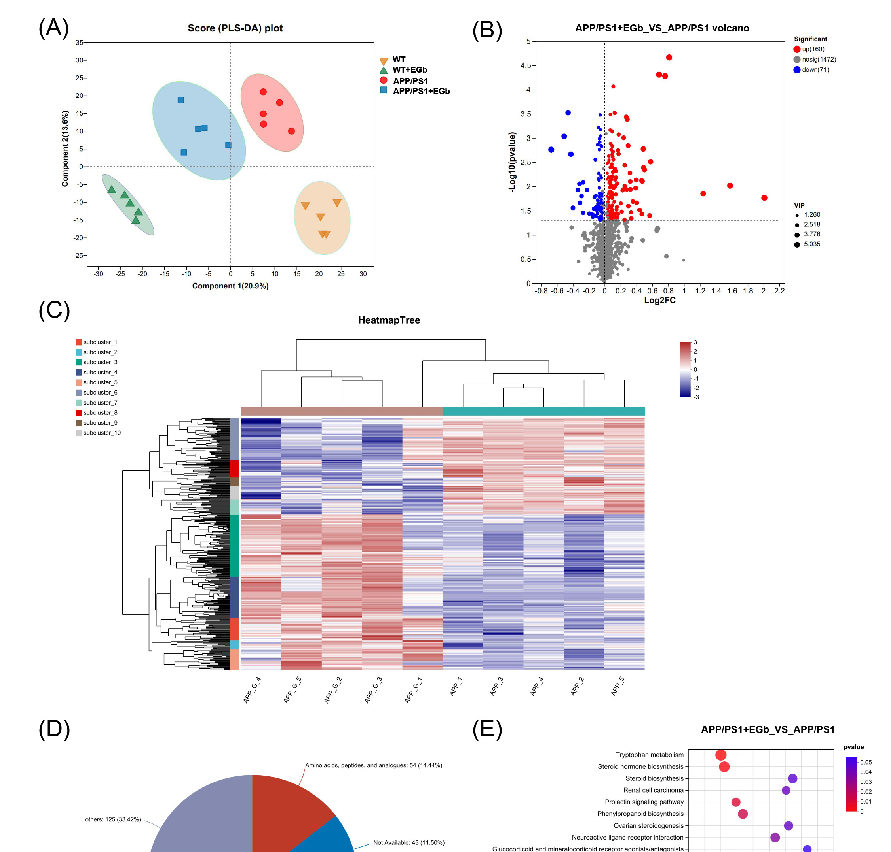
Metabolomic profiling of cecal or fecal contents comparing Ginkgo biloba-treated and control groups. OPLS-DA or PCA score plots demonstrate separation of metabolic profiles between treatment conditions.
Ginkgo biloba Extract Drives Gut Flora and Microbial Metabolism Variation in a …
Volcano plot or heatmap of differentially abundant metabolites identified in the gut of Ginkgo biloba-treated Alzheimer's model mice. Metabolites related to tryptophan, bile acid, and short-chain fatty acid pathways are highlighted.
Ginkgo biloba Extract Drives Gut Flora and Microbial Metabolism Variation in a …
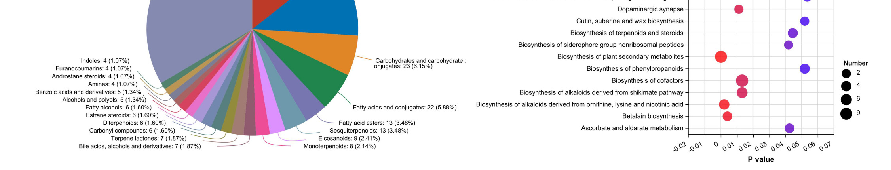
Pathway enrichment analysis of significantly altered gut metabolites following Ginkgo biloba treatment. KEGG or MetaboAnalyst pathway maps indicate enrichment in neuroactive compound biosynthesis and anti-inflammatory metabolic routes.
Ginkgo biloba Extract Drives Gut Flora and Microbial Metabolism Variation in a …

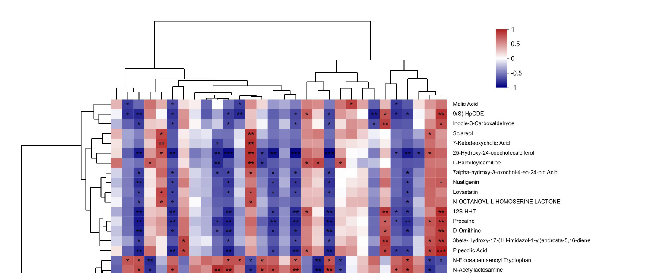
Correlation matrix between differentially abundant gut metabolites and specific bacterial genera altered by Ginkgo biloba treatment. Strong associations suggest mechanistic links between microbial metabolism and the brain-gut axis in Alzheimer's disease.
Ginkgo biloba Extract Drives Gut Flora and Microbial Metabolism Variation in a …
Integrated multi-omics summary linking Ginkgo biloba-induced changes in gut microbiota, microbial metabolites, and neurological outcomes in the Alzheimer's mouse model. Proposed mechanistic pathways connecting gut flora modulation to brain-gut axis signaling are illustrated.
Ginkgo biloba Extract Drives Gut Flora and Microbial Metabolism Variation in a …
Serum or plasma biomarker analysis comparing inflammatory cytokine levels between Ginkgo biloba-treated and control Alzheimer's model mice. Markers such as IL-6, TNF-alpha, and IL-1beta are quantified.
Ginkgo biloba Extract Drives Gut Flora and Microbial Metabolism Variation in a …
Immunohistochemistry or immunofluorescence images of intestinal tissue showing tight junction protein expression in Ginkgo biloba-treated versus control mice. Gut barrier integrity markers such as ZO-1 and occludin are assessed.
Ginkgo biloba Extract Drives Gut Flora and Microbial Metabolism Variation in a …
Страница 7 из 16