Figure 8
960 × 978px
· 212.7 KB
Source Paper
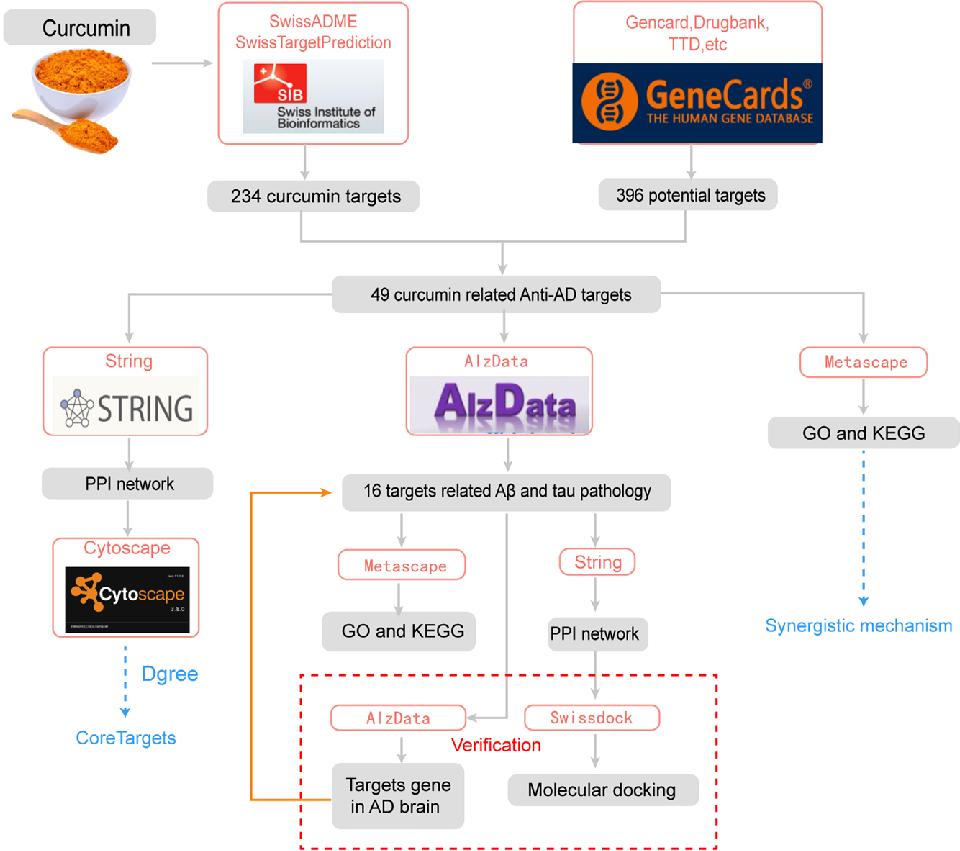
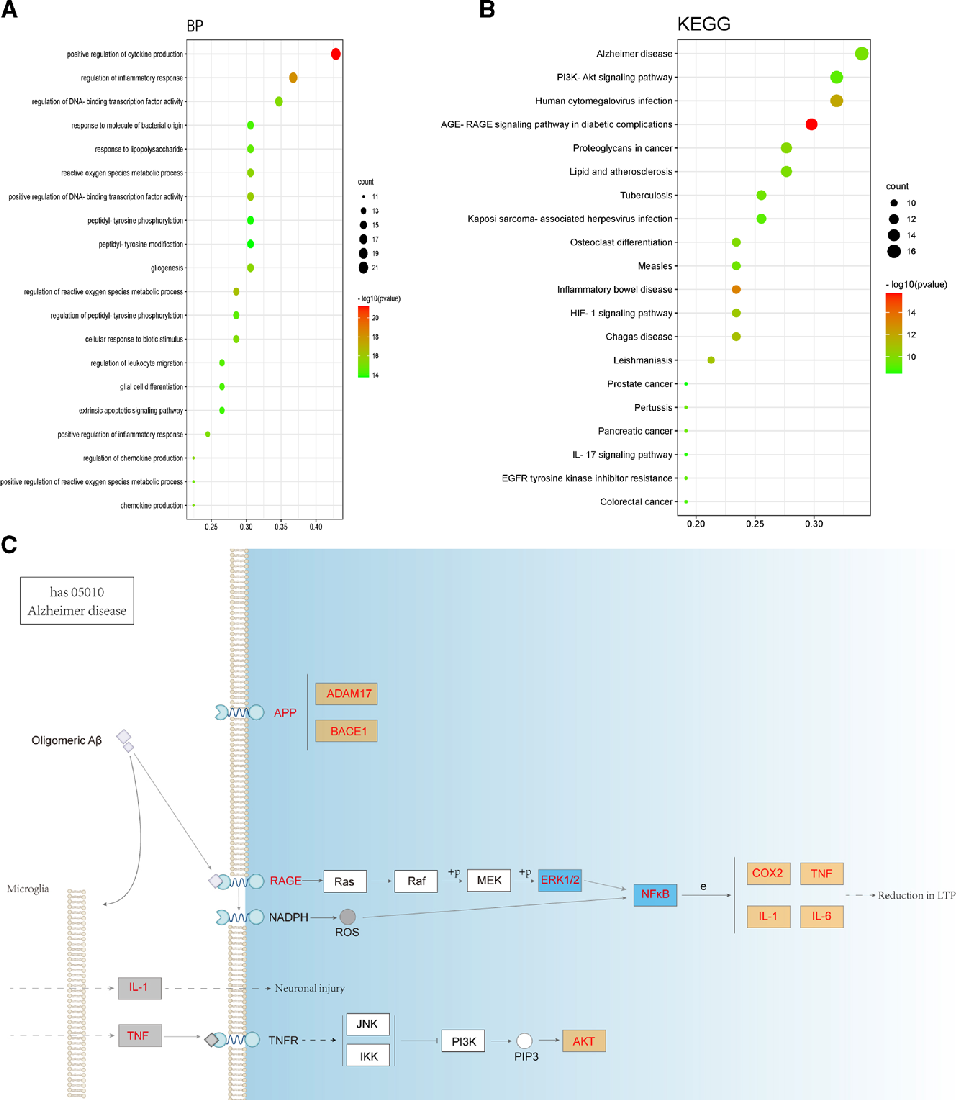
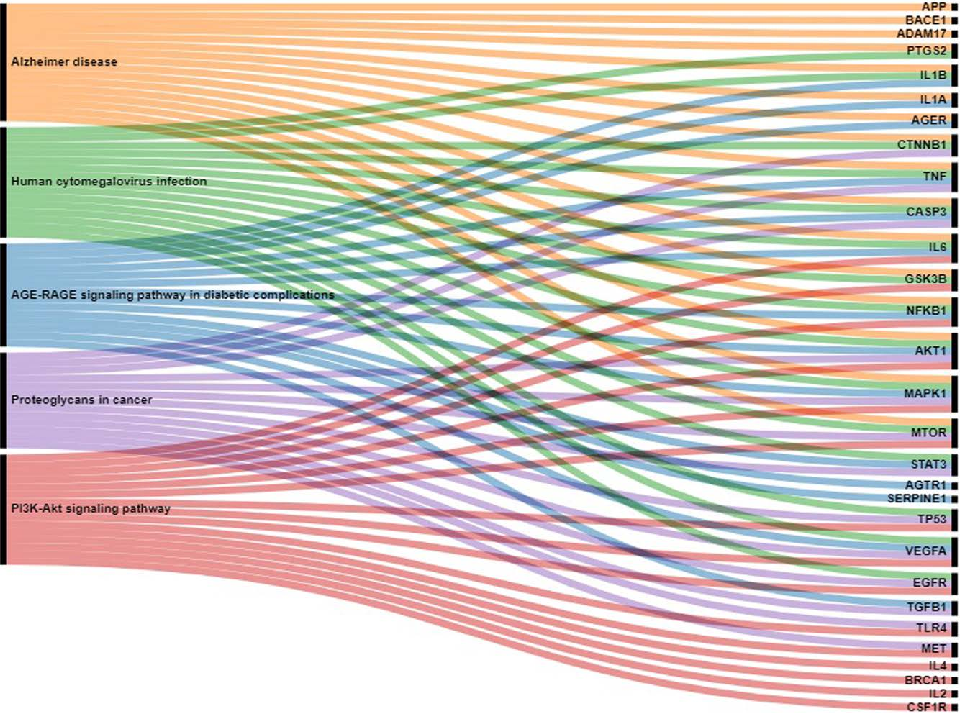
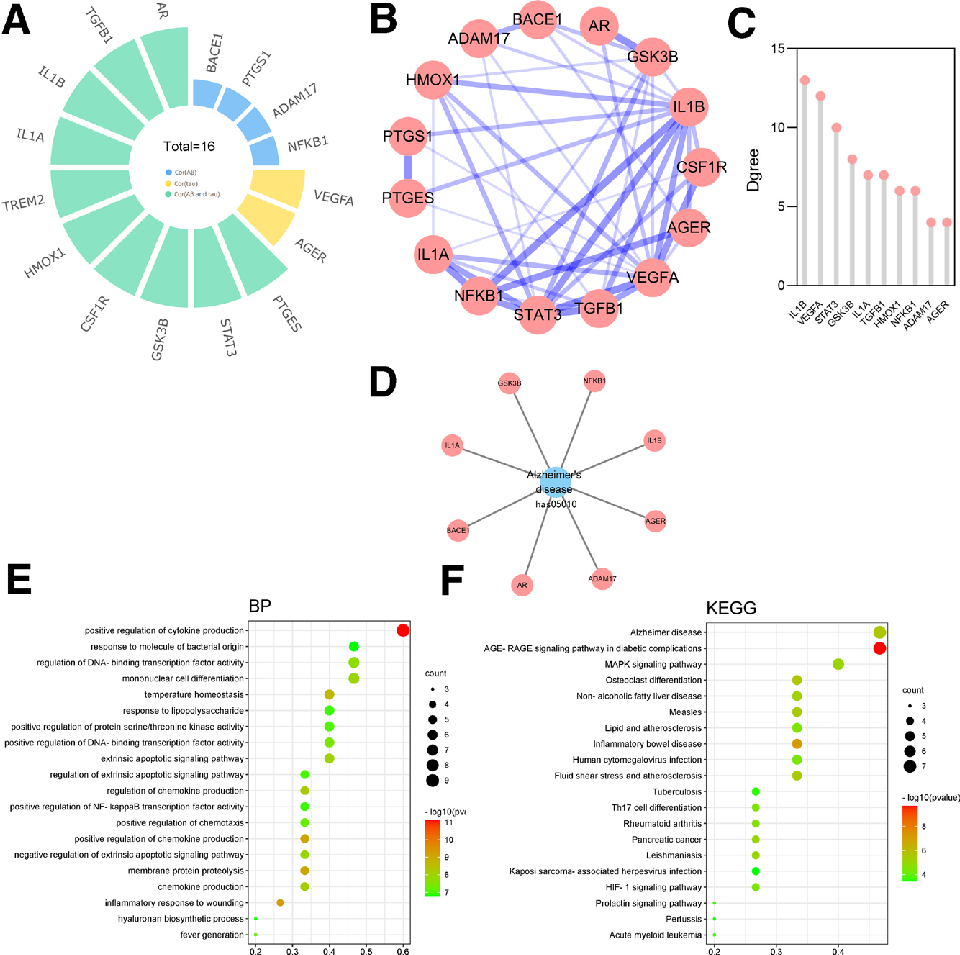
A network pharmacology approach to identify the mechanisms and molecular targets of curcumin against Alzheimer disease.Cite This Figure
 > Source: Xinyan Wu et al. "A network pharmacology approach to identify the mechanisms and molecular targets." *Medicine*, 2022. PMID: [36042609](https://pubmed.ncbi.nlm.nih.gov/36042609/)
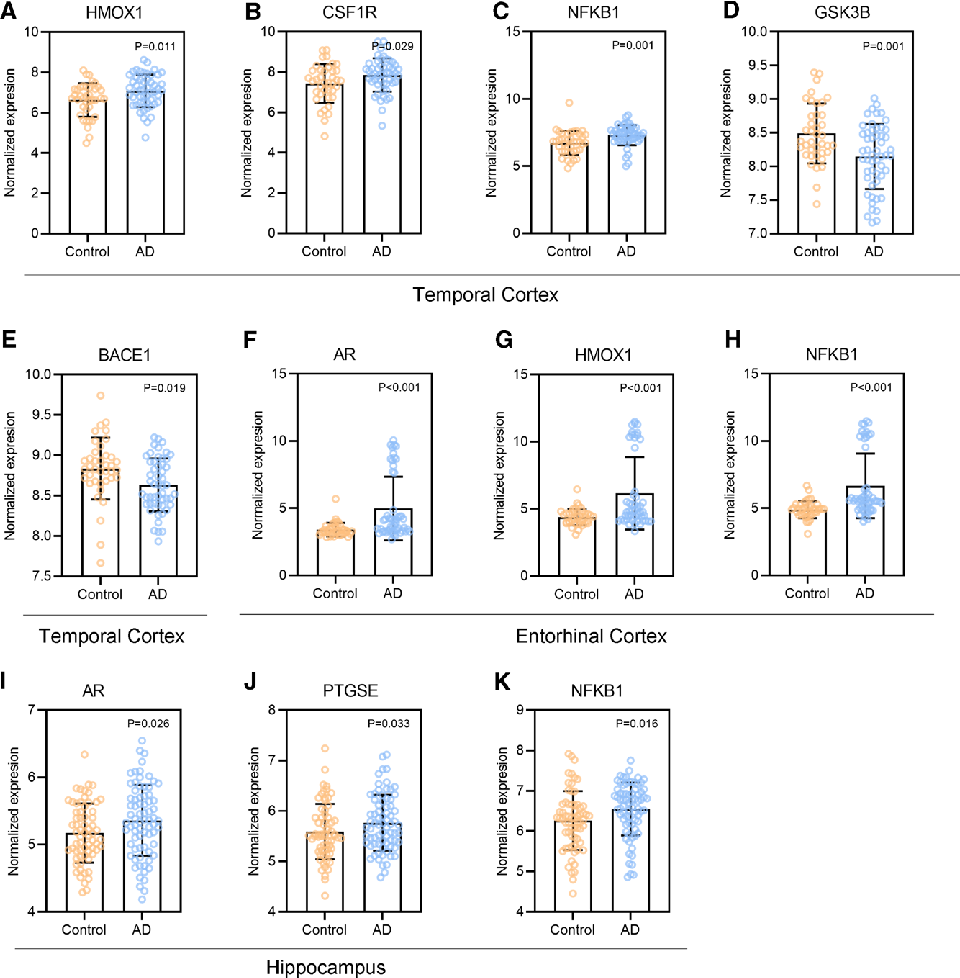
<figure>
  <img src="https://pdfs.citedhealth.com/figures/36042609/188.png" alt="Figure 7. (A–E) Differential gene expression compared to the control group in the temporal cortex (F–H) Differential gene expression compared to the control group in the entorhinal cortex. (F–H) Differential gene expression compared to the control group i" />
  <figcaption>Figure 8. Figure 7. (A–E) Differential gene expression compared to the control group in the temporal cortex (F–H) Differential gene expression compared to the control group in the entorhinal cortex. (F–H) Differential gene expression compared to the control group i<br>  Source: Xinyan Wu et al. "A network pharmacology approach to identify the mechanisms and molecular targets." <em>Medicine</em>, 2022. PMID: <a href="https://pubmed.ncbi.nlm.nih.gov/36042609/">36042609</a></figcaption>
</figure>