Forschungsprozess
368 Abbildungen aus begutachteter Forschung
Heatmap of top differentially abundant metabolites clusters precocious and normal crabs into distinct groups based on metabolic signatures.
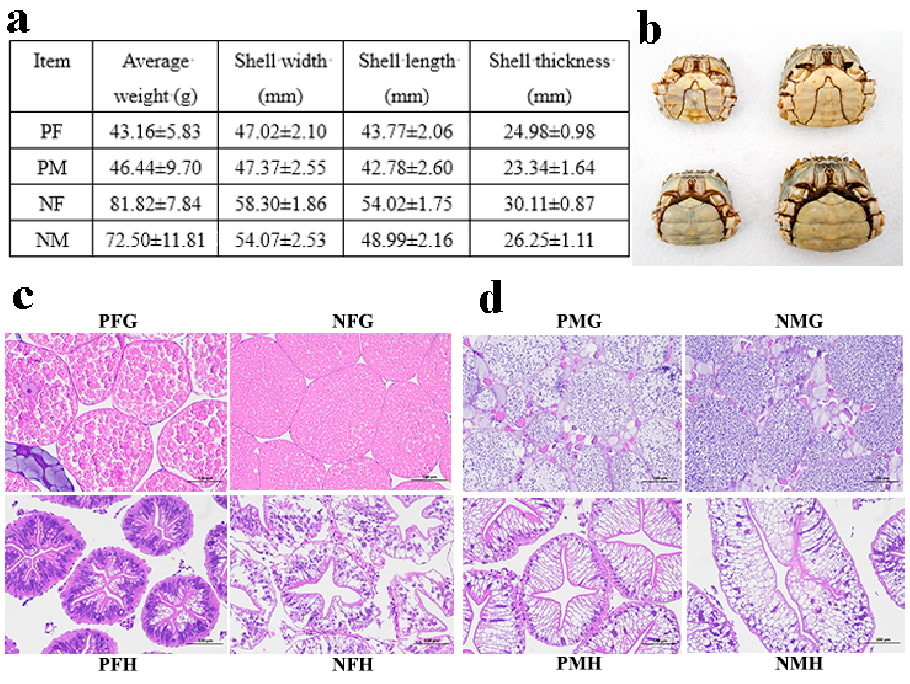
Integrated Analysis of Transcriptomics and Metabolomics Unveil the Novel Insight of One-Year-Old …
Lipid metabolite classes are quantified across crab groups, showing elevated steroid and fatty acid metabolites associated with the precocious phenotype.
Integrated Analysis of Transcriptomics and Metabolomics Unveil the Novel Insight of One-Year-Old …
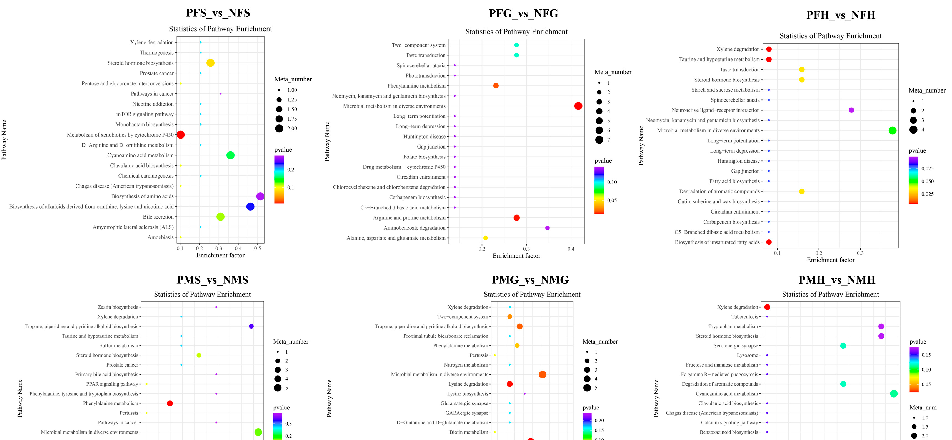
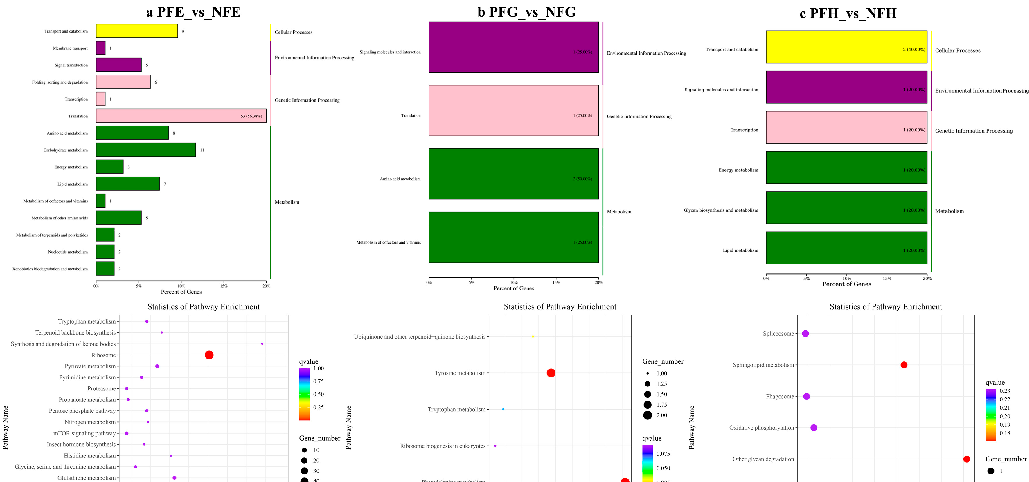
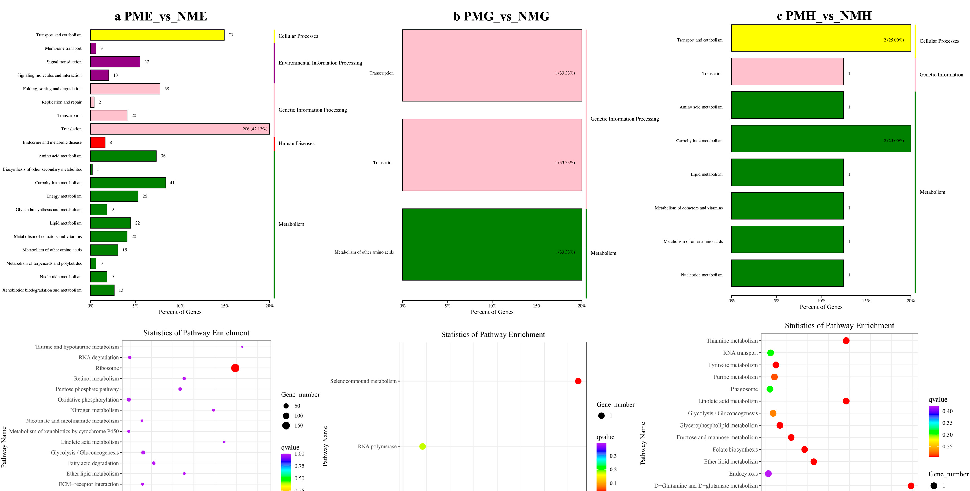
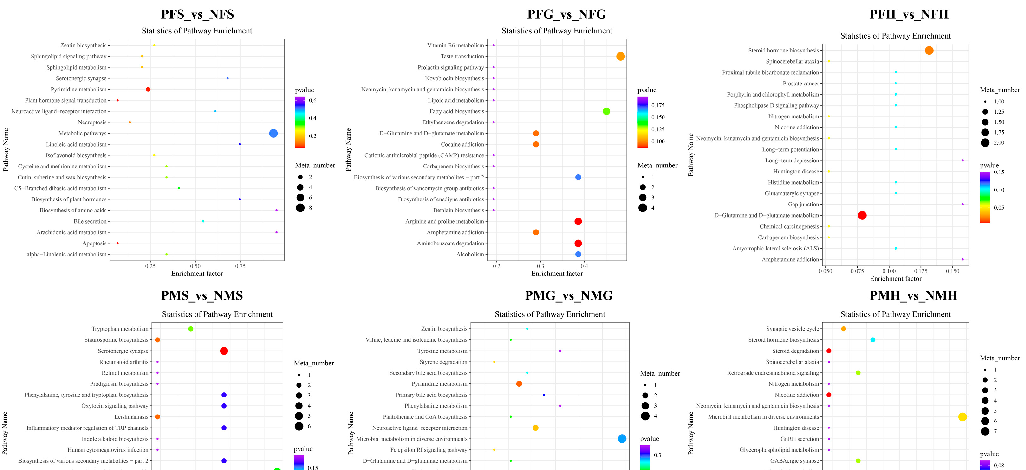
Integrated pathway visualization connects transcriptomic gene expression changes to metabolomic shifts in the phenylalanine metabolism pathway of precocious crabs.
Integrated Analysis of Transcriptomics and Metabolomics Unveil the Novel Insight of One-Year-Old …
Quantitative PCR validation confirms the differential expression of selected genes identified in the transcriptomic analysis between precocious and normal crabs.
Integrated Analysis of Transcriptomics and Metabolomics Unveil the Novel Insight of One-Year-Old …
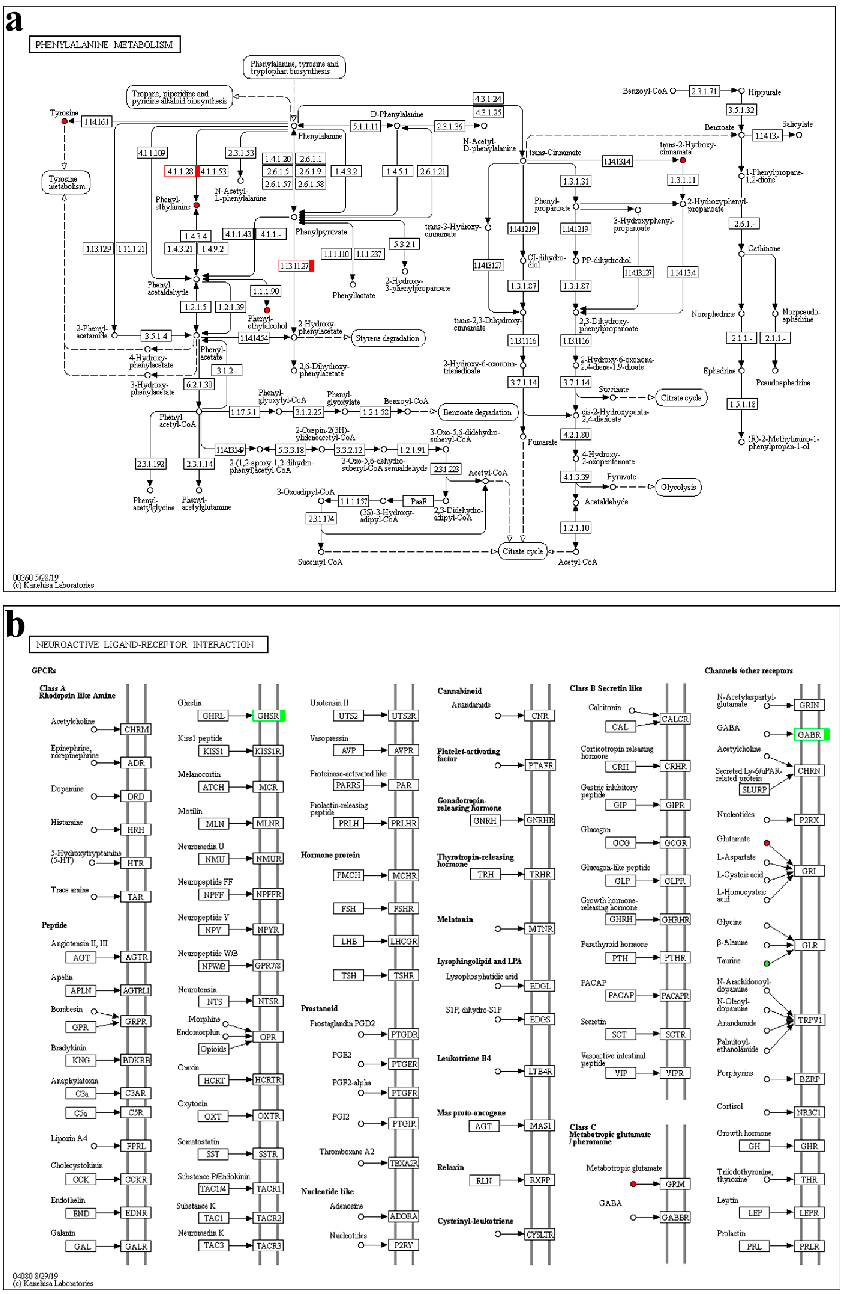
KEGG pathway maps for phenylalanine metabolism and neuroactive ligand-receptor interaction show up- and down-regulated components in precocious crabs, with red indicating increased expression.
Integrated Analysis of Transcriptomics and Metabolomics Unveil the Novel Insight of One-Year-Old …
Supplementary integrated analysis data provides additional support for the multi-omics characterization of precocious development in Eriocheir sinensis.
Integrated Analysis of Transcriptomics and Metabolomics Unveil the Novel Insight of One-Year-Old …
Blood levels of DHA, EPA, and arachidonic acid are tracked over the intervention period, confirming adherence and bioavailability of the fatty acid supplement.
Effects of Long-Chain Polyunsaturated Fatty Acids in Combination with Lutein and Zeaxanthin …
Plasma lutein and zeaxanthin concentrations are compared between treatment and control groups, demonstrating successful supplementation and absorption.
Effects of Long-Chain Polyunsaturated Fatty Acids in Combination with Lutein and Zeaxanthin …
Macular pigment optical density measurements assess the accumulation of lutein and zeaxanthin in the retina following supplementation.
Effects of Long-Chain Polyunsaturated Fatty Acids in Combination with Lutein and Zeaxanthin …
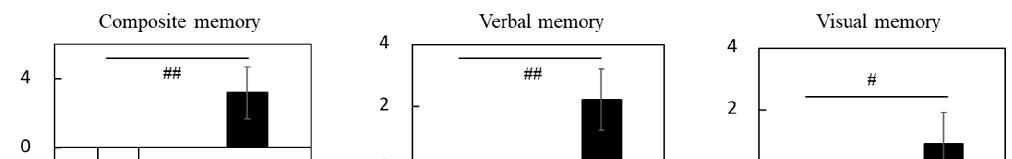
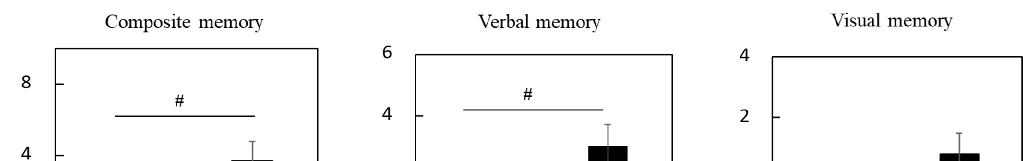
Verbal memory test performance including word recall and recognition tasks is compared between supplementation and placebo groups.
Effects of Long-Chain Polyunsaturated Fatty Acids in Combination with Lutein and Zeaxanthin …
Visual memory and spatial recall scores are assessed following LCPUFA and lutein/zeaxanthin supplementation compared to placebo.
Effects of Long-Chain Polyunsaturated Fatty Acids in Combination with Lutein and Zeaxanthin …

Working memory and executive function task results are presented for both treatment arms, assessing broader cognitive effects of the combined supplementation.
Effects of Long-Chain Polyunsaturated Fatty Acids in Combination with Lutein and Zeaxanthin …
Processing speed assessments compare reaction time and cognitive throughput between the supplemented and placebo groups.
Effects of Long-Chain Polyunsaturated Fatty Acids in Combination with Lutein and Zeaxanthin …
Subgroup analyses stratify cognitive outcomes by baseline DHA status, revealing whether individuals with lower initial omega-3 levels benefit more from supplementation.
Effects of Long-Chain Polyunsaturated Fatty Acids in Combination with Lutein and Zeaxanthin …
Adverse event reporting and safety data demonstrate the tolerability of combined LCPUFA and carotenoid supplementation in older adults.
Effects of Long-Chain Polyunsaturated Fatty Acids in Combination with Lutein and Zeaxanthin …
Correlation analysis between blood fatty acid levels and episodic memory improvements explores dose-response relationships in the supplementation trial.
Effects of Long-Chain Polyunsaturated Fatty Acids in Combination with Lutein and Zeaxanthin …

Additional cognitive domain scores including attention and language fluency are compared between groups as secondary outcome measures.
Effects of Long-Chain Polyunsaturated Fatty Acids in Combination with Lutein and Zeaxanthin …
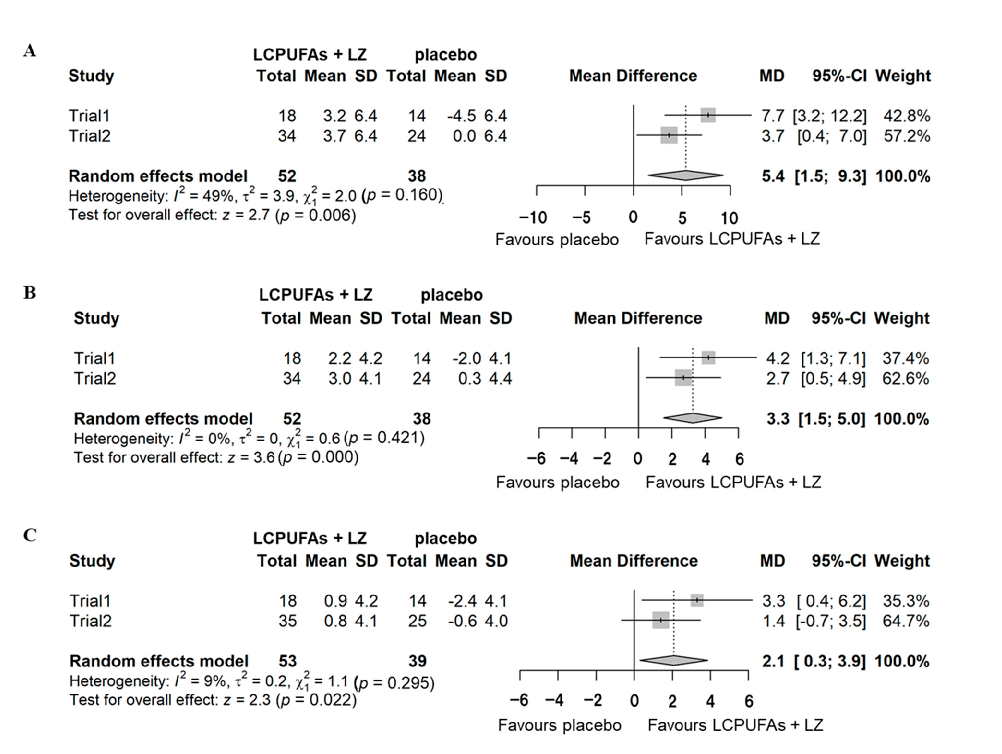
Combined analysis of episodic memory score changes in subgroups with low versus adequate baseline omega-3 status indicates differential treatment responses to LCPUFA supplementation with lutein and zeaxanthin.
Effects of Long-Chain Polyunsaturated Fatty Acids in Combination with Lutein and Zeaxanthin …
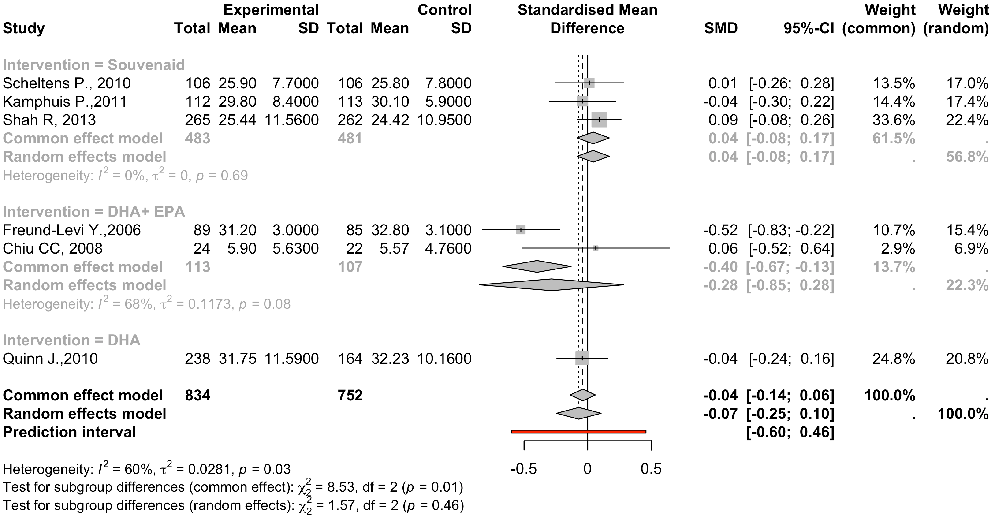
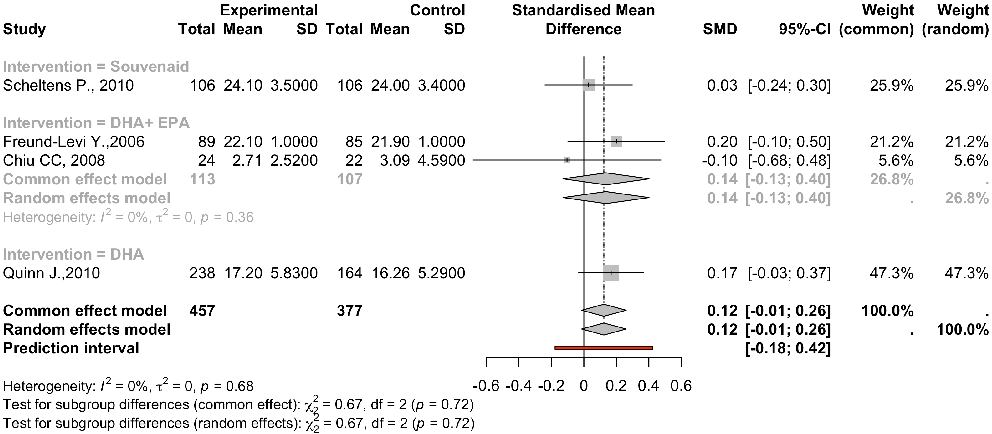
Forest plot of randomized controlled trials evaluates the pooled effect of omega-3, DHA, and EPA supplementation on cognitive function scores in Alzheimer's disease patients.
The effects of omega-3, DHA, EPA, Souvenaid® in Alzheimer's disease: A systematic …
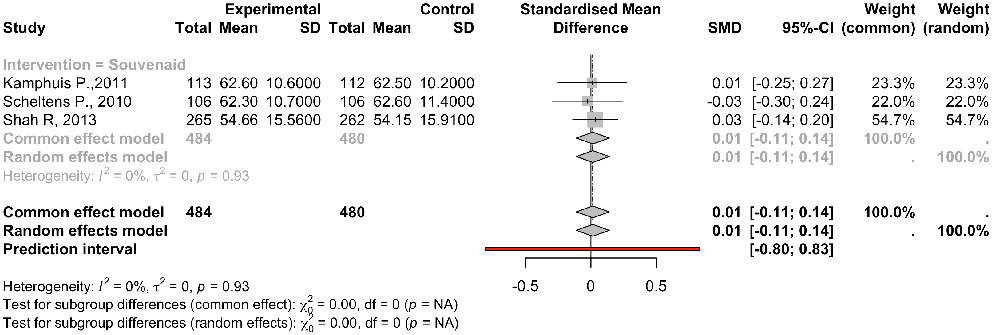
Subgroup analysis by intervention type separates the effects of pure omega-3 supplements from the multinutrient Souvenaid formulation on Alzheimer's disease outcomes.
The effects of omega-3, DHA, EPA, Souvenaid® in Alzheimer's disease: A systematic …
Forest plot assessing the impact of omega-3 supplementation on functional daily living activities in Alzheimer's disease patients across included trials.
The effects of omega-3, DHA, EPA, Souvenaid® in Alzheimer's disease: A systematic …
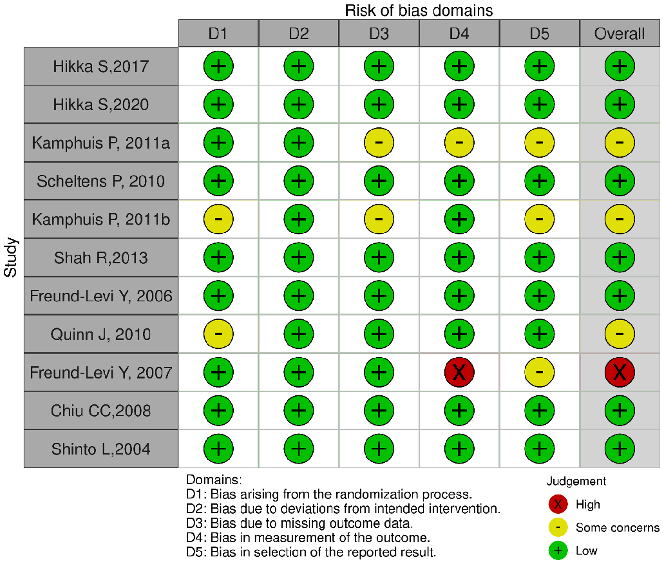
Risk of bias assessment for included studies is visualized using the Cochrane tool, indicating overall moderate quality of evidence across the meta-analysis.
The effects of omega-3, DHA, EPA, Souvenaid® in Alzheimer's disease: A systematic …
Funnel plot analysis evaluates publication bias across the studies included in the systematic review of omega-3 fatty acids for Alzheimer's disease.
The effects of omega-3, DHA, EPA, Souvenaid® in Alzheimer's disease: A systematic …
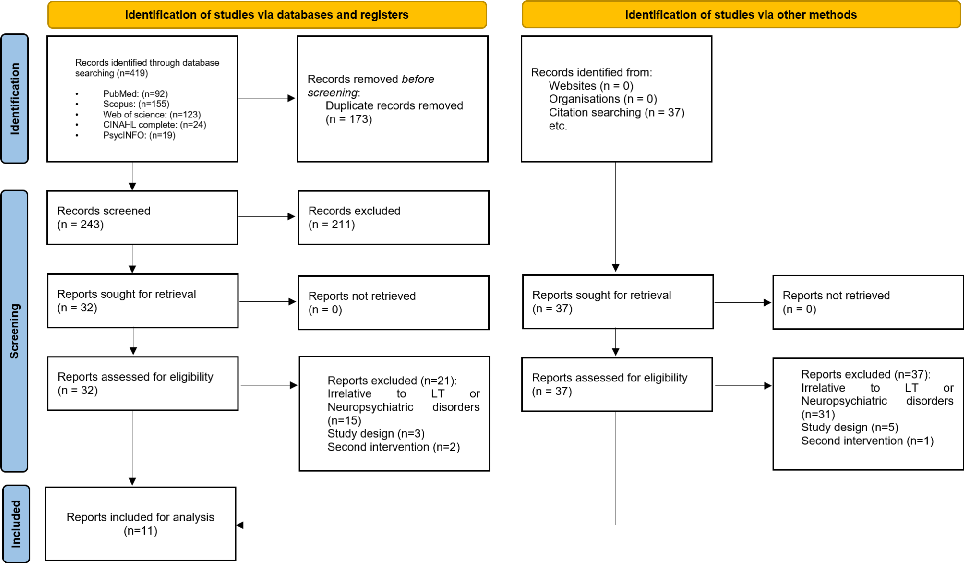
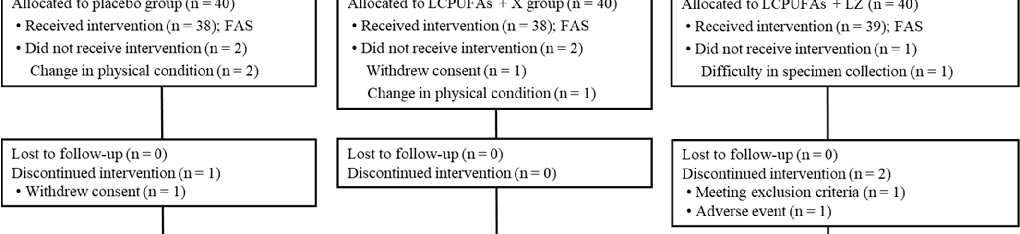
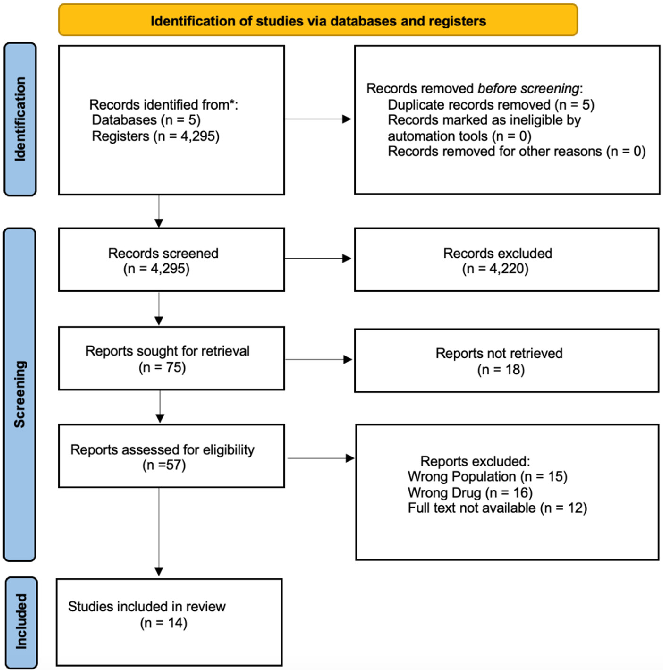
Fig. 1 PRISMA flowchart of all included studies
The effects of L-theanine supplementation on the outcomes of patients with mental …
Seite 10 von 16