Phosphatidylserine Figures
8 figures from peer-reviewed research
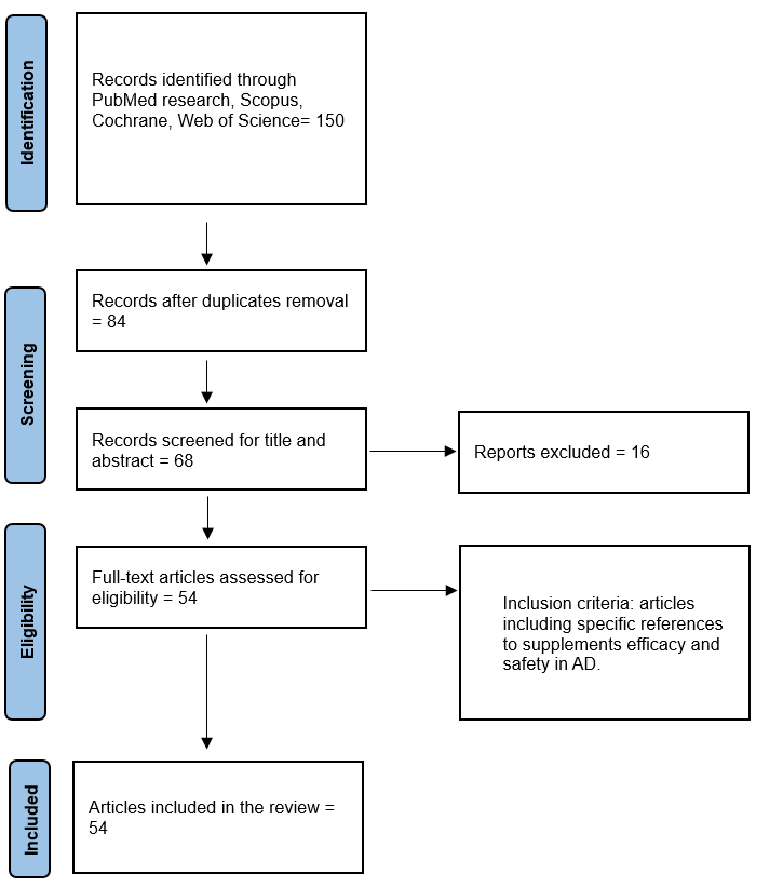
Figure 1. Flow-chart.
Exploring the Efficacy and Safety of Nutritional Supplements in Alzheimer's Disease.
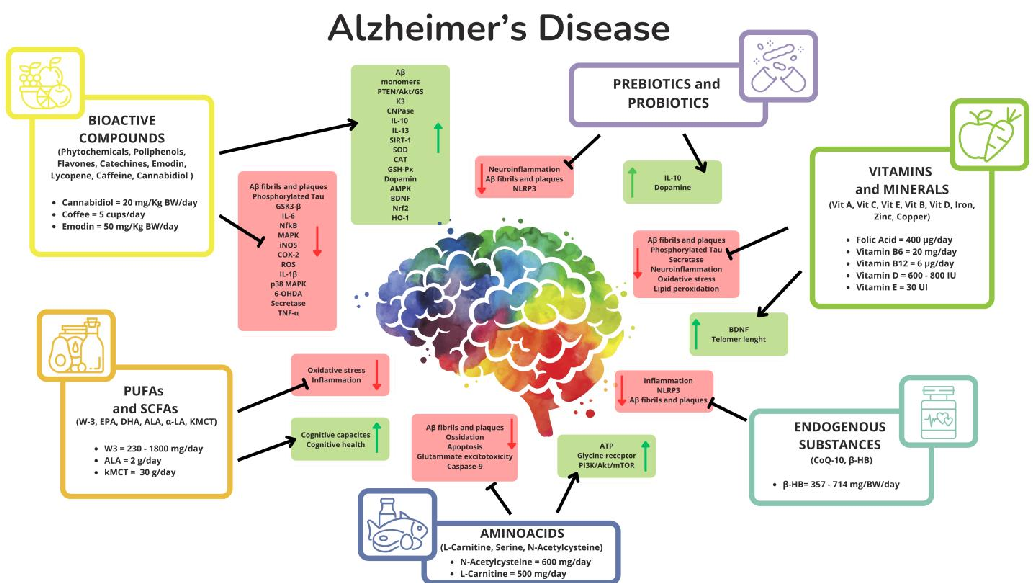
Exploring the Efficacy and Safety of Nutritional Supplements in Alzheimer's Disease.
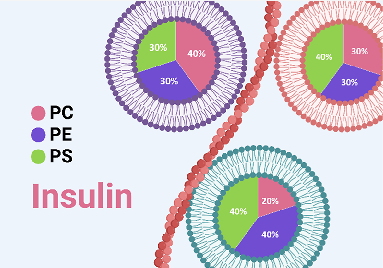
Concentration of Phosphatidylserine Influence Rates of Insulin Aggregation and Toxicity of Amyloid …
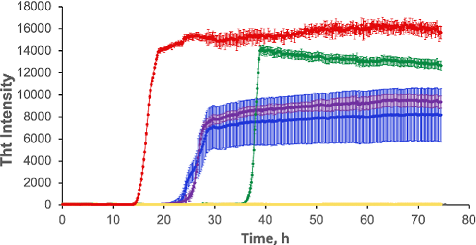
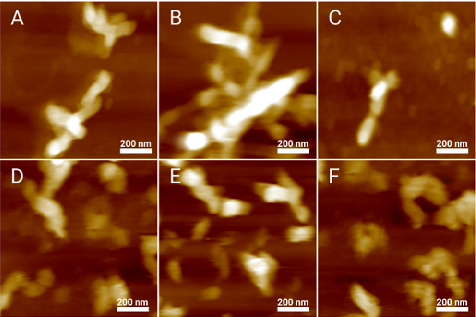
Figure 1. Increase in the concentration of PS in the lipid mixtures increases the aggregation rate of insulin. Averages of triplicates of ThT aggregation kinetics of insulin (Ins) in the …
Concentration of Phosphatidylserine Influence Rates of Insulin Aggregation and Toxicity of Amyloid …
Concentration of Phosphatidylserine Influence Rates of Insulin Aggregation and Toxicity of Amyloid …
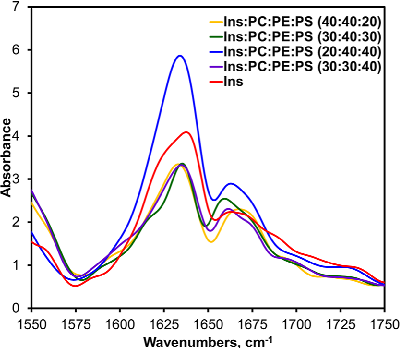
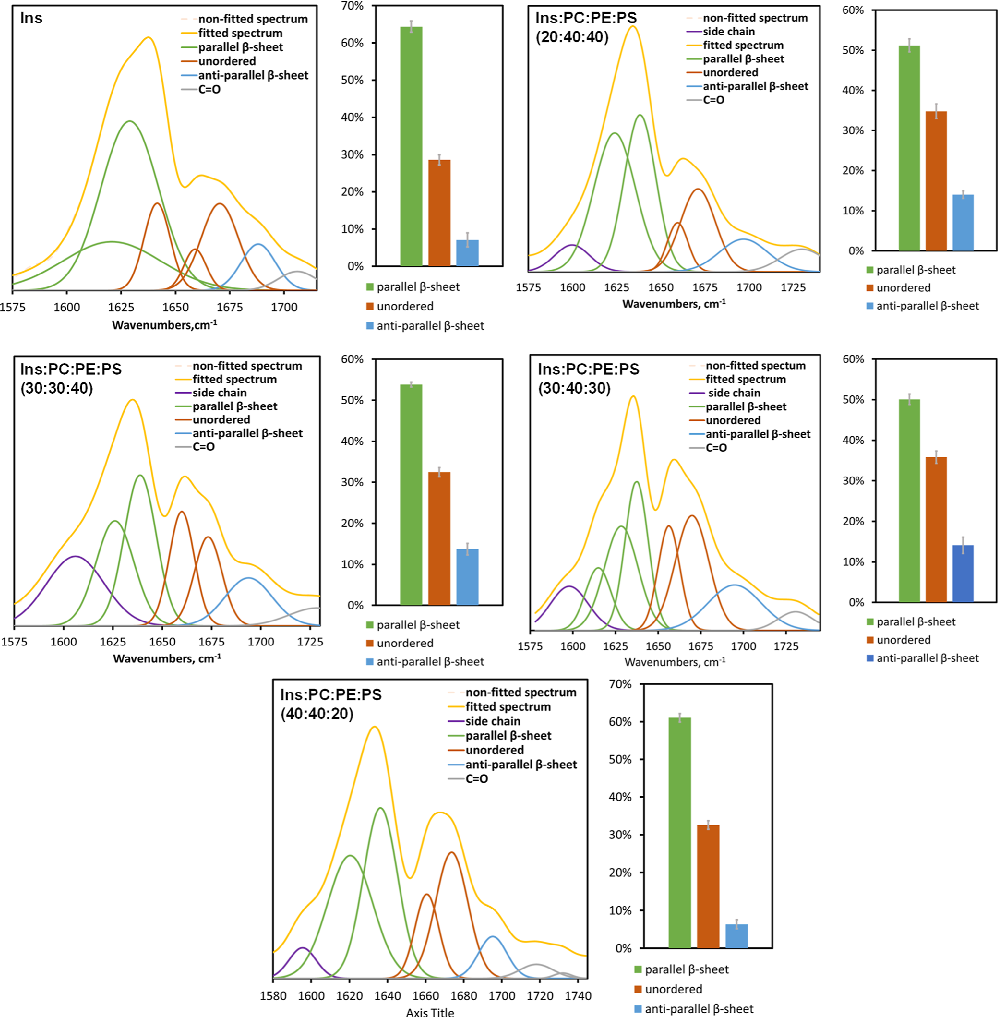
Figure 4. AFM-IR spectra acquired from insulin (Ins) fibrils grown in the lipid-free environment (red), insulin in the presence of LUVs of PC/PE/PS (40:40:20) (yellow), PC/PE/PS (30:40:30) (green), PC/ PE/PS …
Concentration of Phosphatidylserine Influence Rates of Insulin Aggregation and Toxicity of Amyloid …
Concentration of Phosphatidylserine Influence Rates of Insulin Aggregation and Toxicity of Amyloid …
Concentration of Phosphatidylserine Influence Rates of Insulin Aggregation and Toxicity of Amyloid …