विवरण
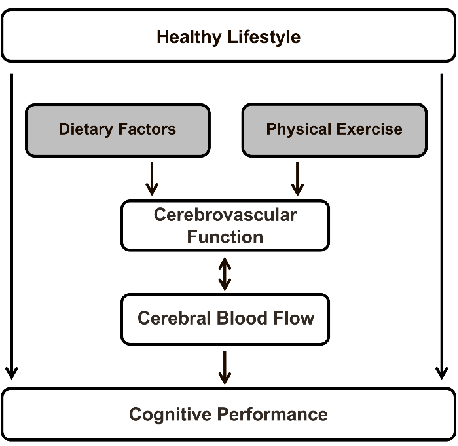
A schematic overview maps the relationships between dietary factors — including nitrate, polyphenols, fatty acids, and caffeine — and their effects on cerebral blood flow, integrating evidence from neuroimaging studies.
More Figures from This Paper
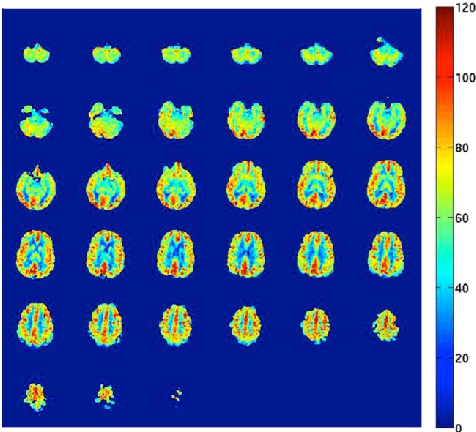
Figure 6
An arterial spin labeling cerebral blood flow map displays regional perfusion in units of milliliters per 100 grams of brain tissue per minute, illustrating the spatial distribution of blood flow across cortical regions.
diagram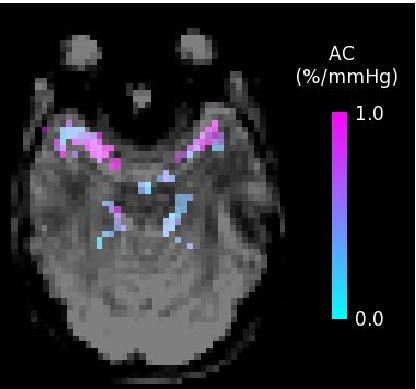
Figure 7
An arterial compliance map shows the percentage change in arterial blood volume per millimeter of mercury, obtained using short inversion time arterial spin labeling to assess cerebrovascular reactivity.
diagramFigure 5
Diagram
458 × 446px
· 21.8 केबी
Source Paper
Cerebral Blood Flow Measurements in Adults: A Review on the Effects of Dietary Factors and Exercise.Cite This Figure
 > Source: Peter J Joris et al. "Cerebral Blood Flow Measurements in Adults: A Review on the Effects of Dietary F." *Nutrients*, 2018. PMID: [29693564](https://pubmed.ncbi.nlm.nih.gov/29693564/)
<figure>
  <img src="https://pdfs.citedhealth.com/figures/29693564/72.png" alt="A schematic overview maps the relationships between dietary factors — including nitrate, polyphenols, fatty acids, and caffeine — and their effects on cerebral blood flow, integrating evidence from neuroimaging studies." />
  <figcaption>Figure 5. A schematic overview maps the relationships between dietary factors — including nitrate, polyphenols, fatty acids, and caffeine — and their effects on cerebral blood flow, integrating evidence from neuroimaging studies.<br>  Source: Peter J Joris et al. "Cerebral Blood Flow Measurements in Adults: A Review on the Effects of Dietary F." <em>Nutrients</em>, 2018. PMID: <a href="https://pubmed.ncbi.nlm.nih.gov/29693564/">29693564</a></figcaption>
</figure>