Processo di ricerca
5 figure da ricerca revisionata da esperti
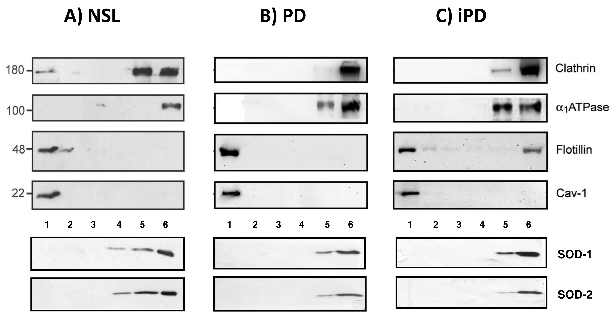
Western blot analyses of protein markers across density gradient fractions from control, Parkinson's disease, and incidental PD brain cortices reveal altered lipid raft protein distribution.
Severe alterations in lipid composition of frontal cortex lipid rafts from Parkinson's …
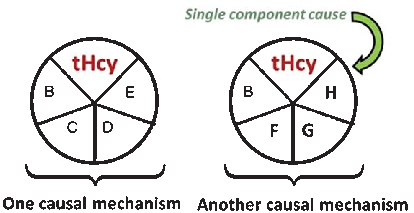
Brain imaging studies demonstrate that elevated homocysteine is associated with accelerated rates of brain atrophy, particularly in medial temporal lobe structures critical for memory. B-vitamin treatment appears to slow this atrophy in individuals with elevated baseline homocysteine.
Homocysteine and Dementia: An International Consensus Statement.
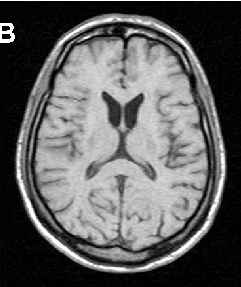
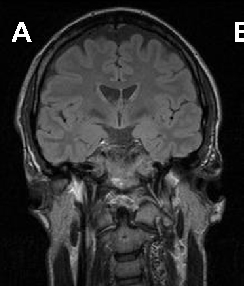
Brain imaging in neuroacanthocytosis typically reveals caudate nucleus atrophy and putaminal changes. This figure presents structural neuroimaging findings characteristic of advanced basal ganglia degeneration in NA patients.
Neuroacanthocytosis syndromes.
Brain imaging in neuroacanthocytosis typically reveals caudate nucleus atrophy and putaminal changes. This figure presents structural neuroimaging findings characteristic of advanced basal ganglia degeneration in NA patients.
Neuroacanthocytosis syndromes.
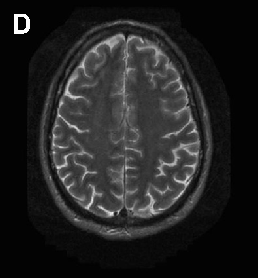
Brain imaging in neuroacanthocytosis typically reveals caudate nucleus atrophy and putaminal changes. This figure presents structural neuroimaging findings characteristic of advanced basal ganglia degeneration in NA patients.
Neuroacanthocytosis syndromes.