연구 프로세스
368 동료 심사 연구의 그림
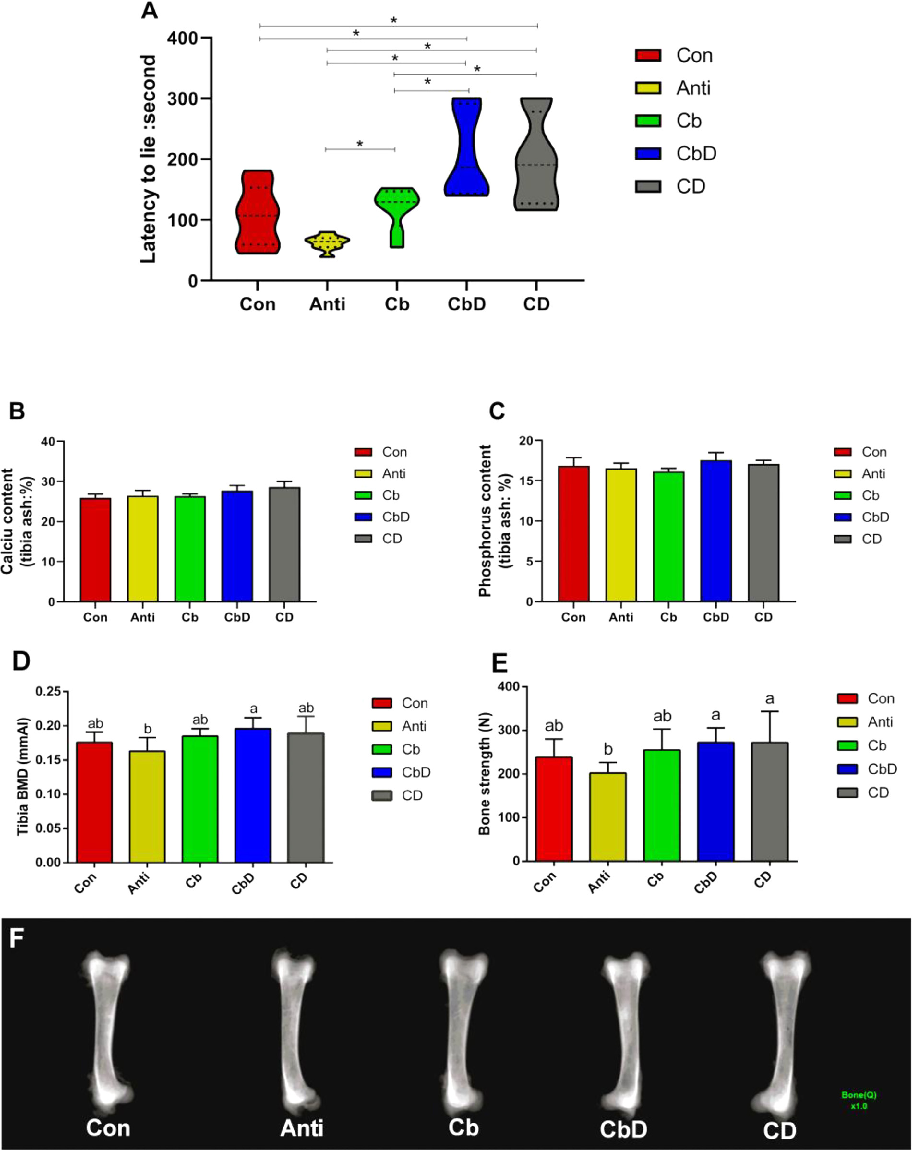
Effects of dietary Clostridium butyricum and 25-hydroxyvitamin D3 supplementation on latency-to-lie time in a poultry model, indicating improvements in leg health and bone strength.
Dietary Clostridium butyricum and 25-Hydroxyvitamin D3 modulate bone metabolism of broilers through …
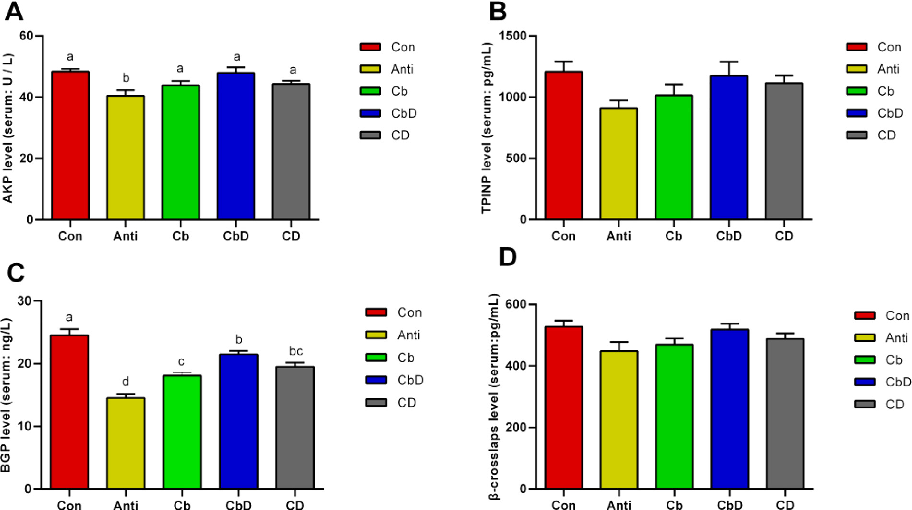
Experimental data from a study on dietary Clostridium butyricum and 25-hydroxyvitamin D3 and their combined effects on bone metabolism through gut microbiota modulation in poultry.
Dietary Clostridium butyricum and 25-Hydroxyvitamin D3 modulate bone metabolism of broilers through …
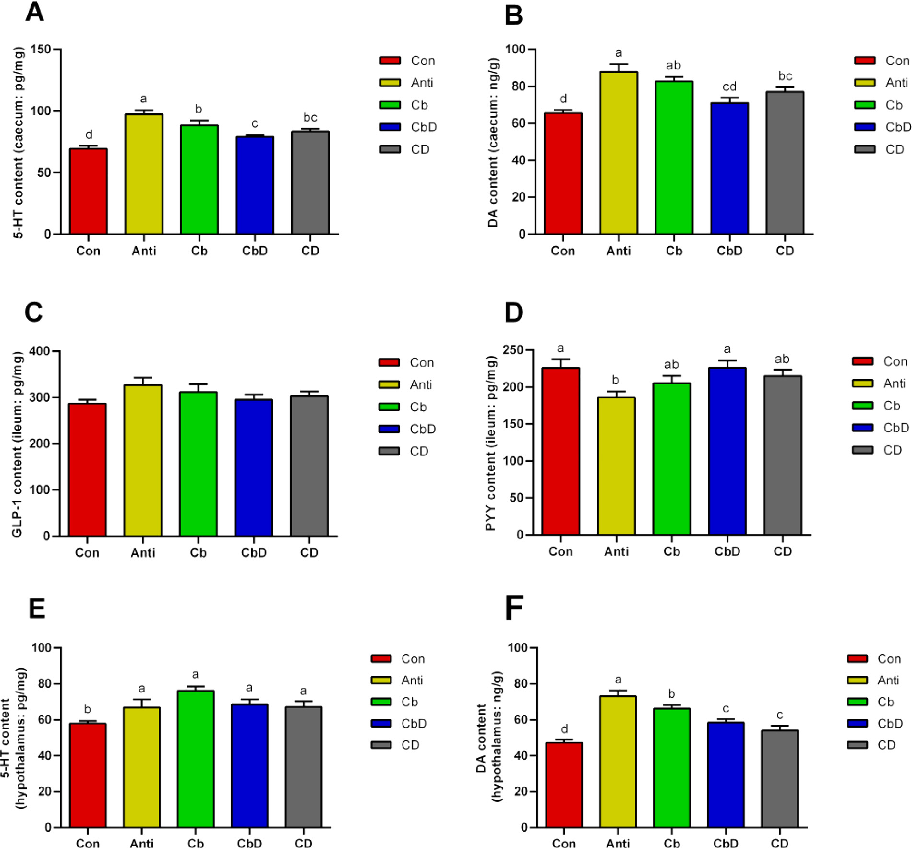
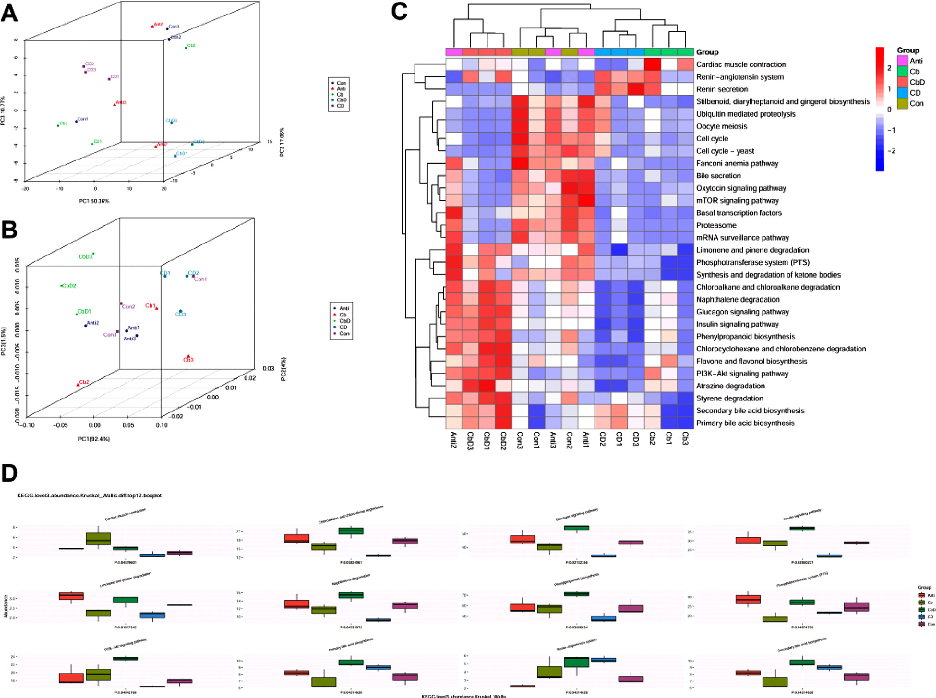
Hypothalamic signaling pathway analysis in poultry fed Clostridium butyricum and 25-hydroxyvitamin D3, examining effects on bone metabolism regulatory mechanisms.
Dietary Clostridium butyricum and 25-Hydroxyvitamin D3 modulate bone metabolism of broilers through …
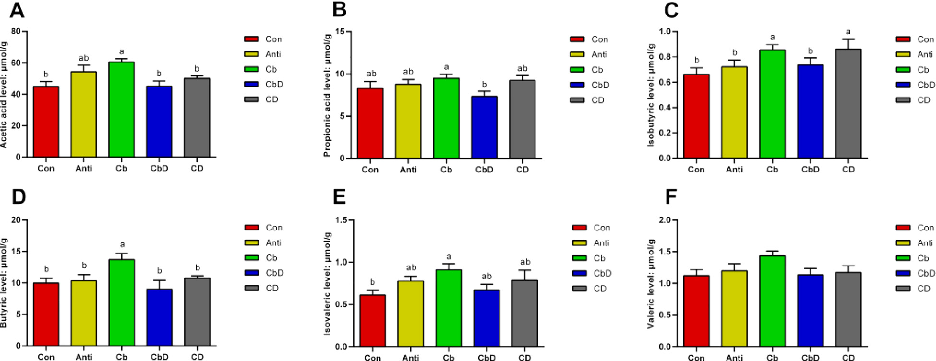
Caecal short-chain fatty acid (SCFA) concentrations in poultry supplemented with Clostridium butyricum and 25-hydroxyvitamin D3, linking gut fermentation products to bone metabolism modulation.
Dietary Clostridium butyricum and 25-Hydroxyvitamin D3 modulate bone metabolism of broilers through …
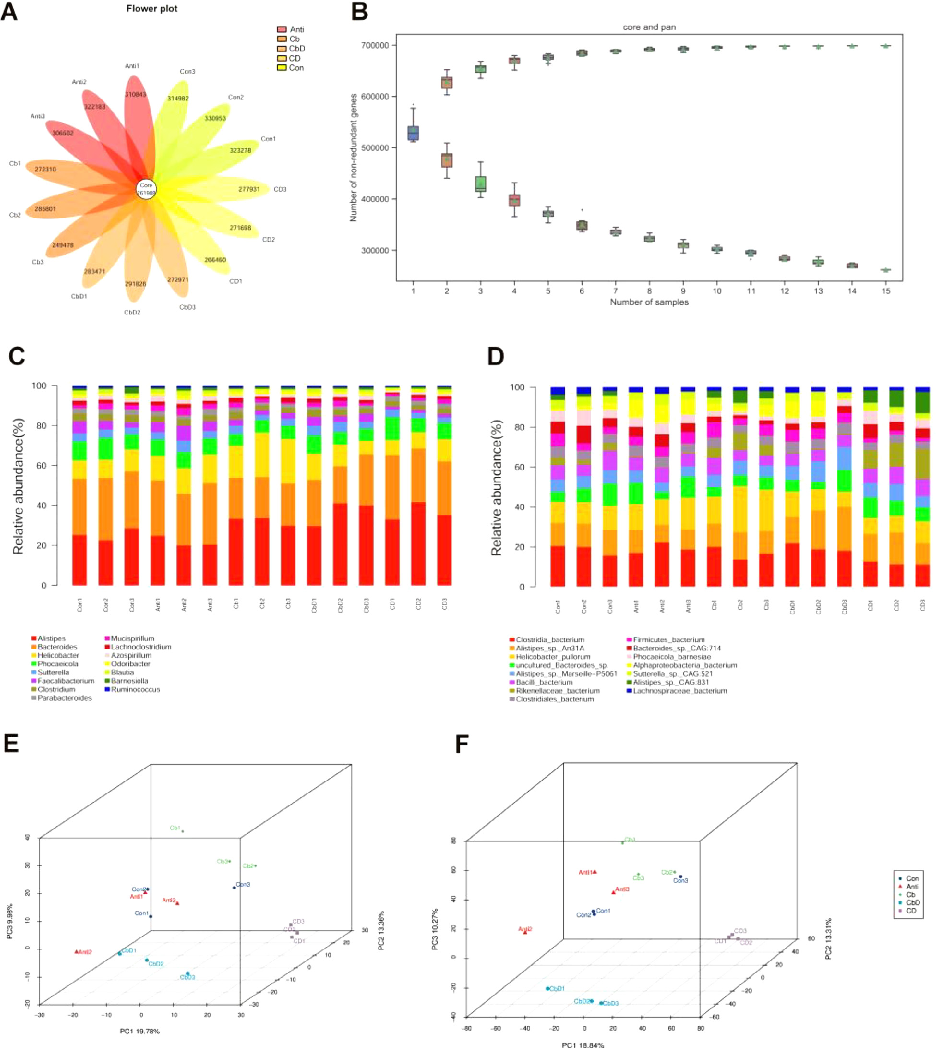
Metagenomic analysis of caecal microbiota in poultry receiving Clostridium butyricum and 25-hydroxyvitamin D3 supplementation, revealing shifts in microbial community structure.
Dietary Clostridium butyricum and 25-Hydroxyvitamin D3 modulate bone metabolism of broilers through …
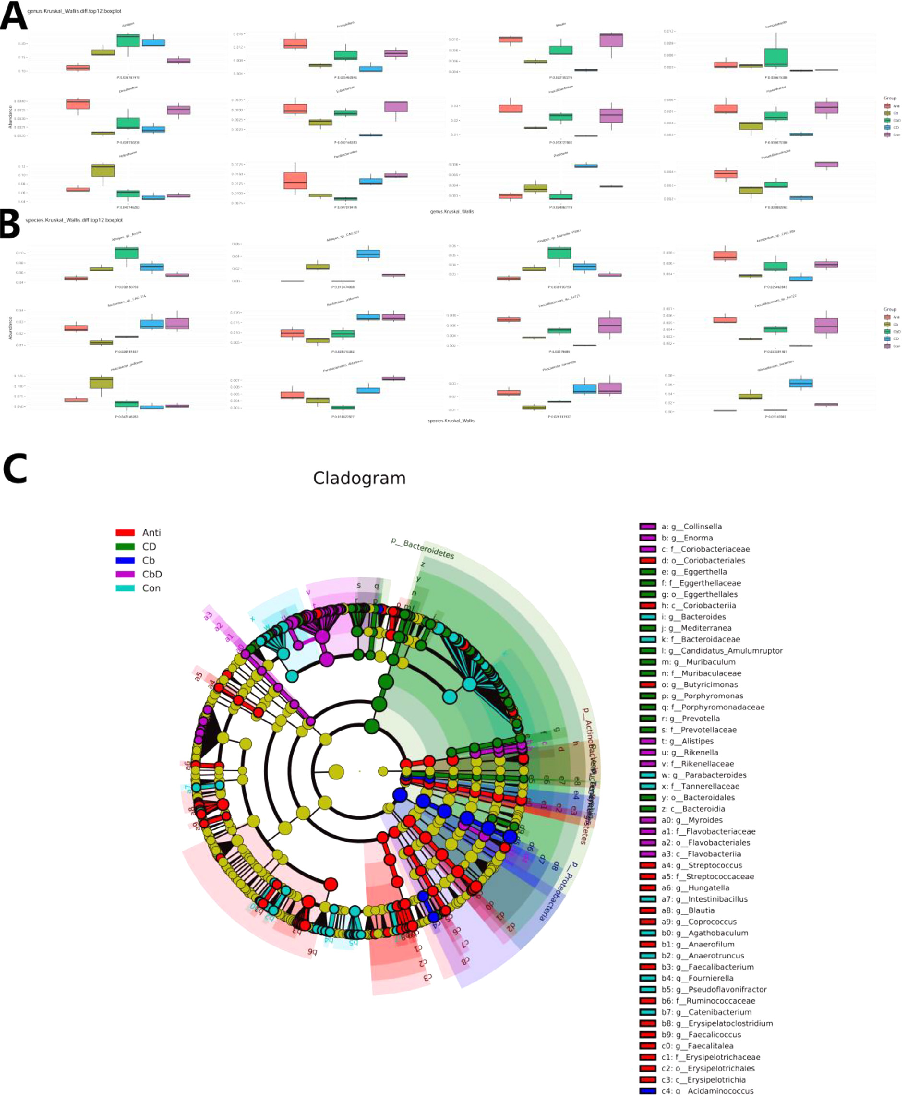
Caecal microbial composition data from poultry treated with Clostridium butyricum and 25-hydroxyvitamin D3, showing taxonomic-level changes associated with improved bone metabolism.
Dietary Clostridium butyricum and 25-Hydroxyvitamin D3 modulate bone metabolism of broilers through …
Metagenomic analysis of caecal microbiota in poultry receiving Clostridium butyricum and 25-hydroxyvitamin D3 supplementation, revealing shifts in microbial community structure.
Dietary Clostridium butyricum and 25-Hydroxyvitamin D3 modulate bone metabolism of broilers through …
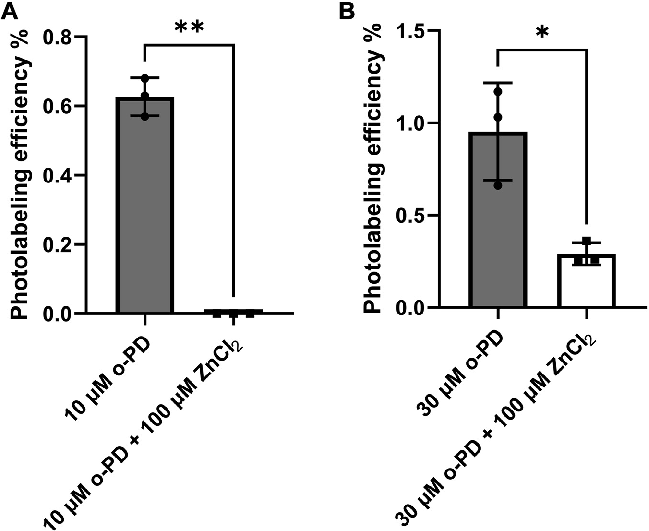
Electrophysiology or binding affinity data for propofol at different GABAA receptor binding sites, comparing potency across the three identified site classes.
Three classes of propofol binding sites on GABAA receptors.
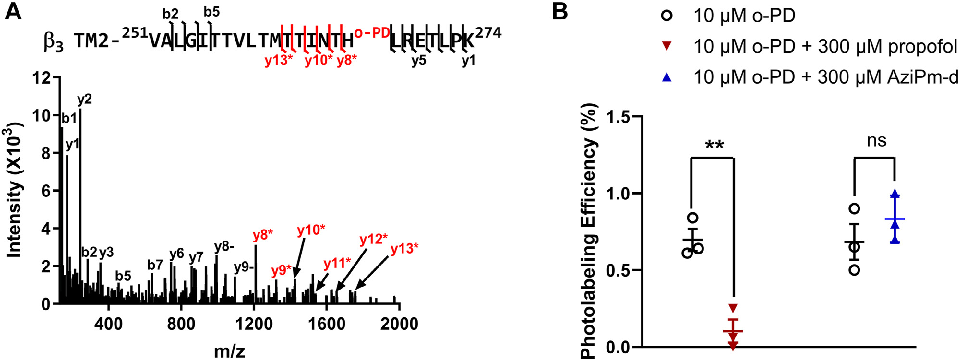
Mutagenesis or competition binding data supporting the classification of three distinct propofol binding site classes on GABAA receptors.
Three classes of propofol binding sites on GABAA receptors.
Structure-activity relationship analysis of propofol analogs at the different GABAA receptor binding sites, informing anesthetic drug design.
Three classes of propofol binding sites on GABAA receptors.
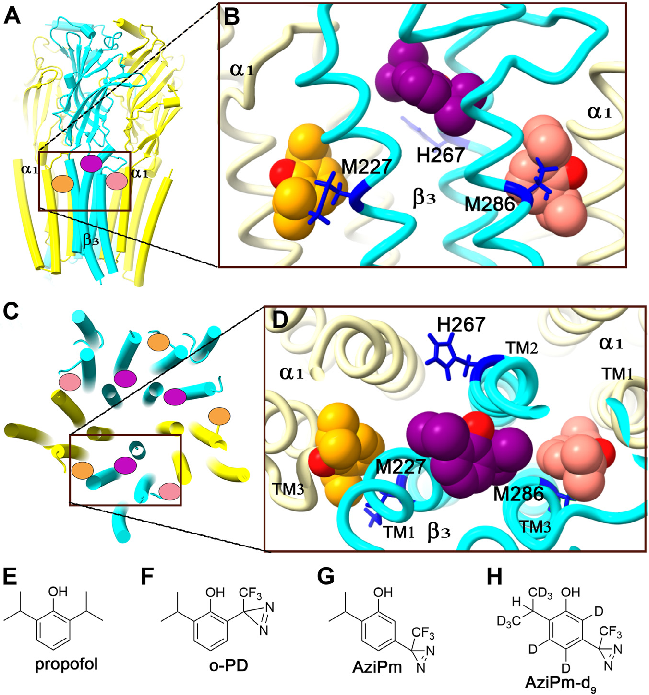
Molecular dynamics simulation or computational modeling of propofol interactions with GABAA receptor transmembrane domains.
Three classes of propofol binding sites on GABAA receptors.
Comparative analysis of propofol binding site occupancy and functional consequences for GABAA receptor channel gating and anesthetic efficacy.
Three classes of propofol binding sites on GABAA receptors.
Supplementary structural or pharmacological data supporting the three-class model of propofol binding to GABAA receptors.
Three classes of propofol binding sites on GABAA receptors.
Synthetic scheme for the preparation of cumene-d11 from benzene-d6, used as a deuterated propofol analog for binding site characterization studies on GABAA receptors.
Three classes of propofol binding sites on GABAA receptors.
Figure 1. Flow chart diagram illustrating the database searches, number of publications identified, screened, and final full texts included in the systematic review.
The Role of Minoxidil in Treatment of Alopecia Areata: A Systematic Review …
The Role of Minoxidil in Treatment of Alopecia Areata: A Systematic Review …
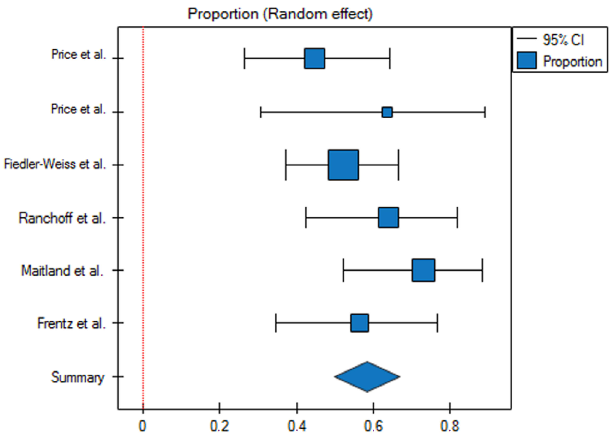
In total, 164 patients treated with less than 5% minoxidil were included in the metaanalysis. For the group of patients using minoxidil at a concentration lower than 5%, the response …
The Role of Minoxidil in Treatment of Alopecia Areata: A Systematic Review …
The Role of Minoxidil in Treatment of Alopecia Areata: A Systematic Review …
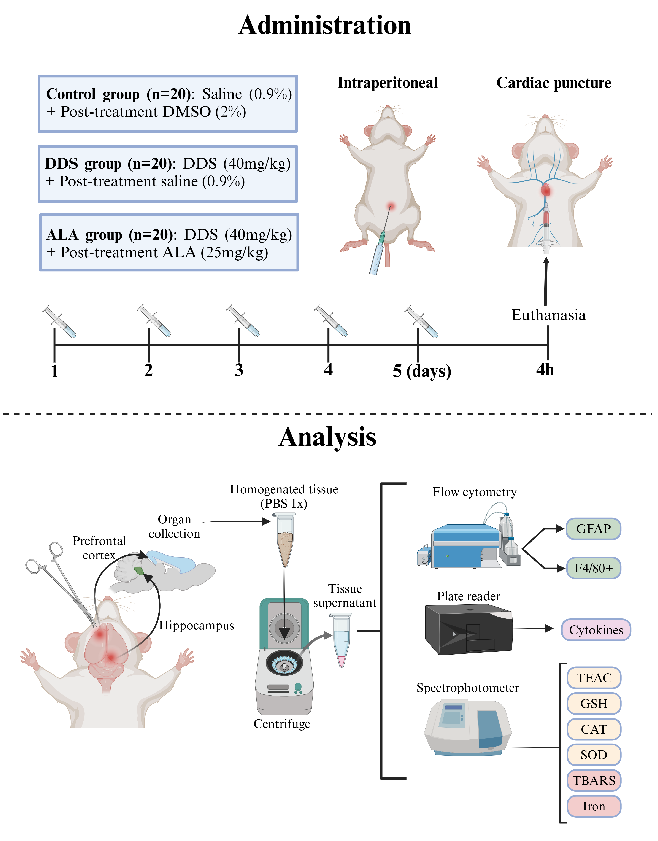
Behavioral or neurological assessment data from a study evaluating alpha-lipoic acid's neuroprotective effects against dapsone-induced neuroinflammation and oxidative stress in an animal model.
Alpha-Lipoic Acid Reduces Neuroinflammation and Oxidative Stress Induced by Dapsone in an …
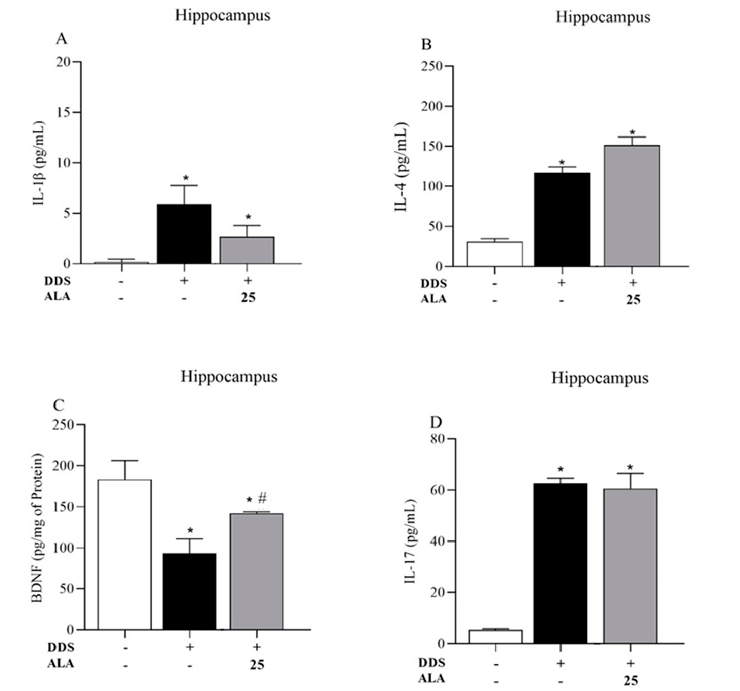
Brain tissue analysis showing markers of neuroinflammation in dapsone-treated animals, comparing alpha-lipoic acid-supplemented versus control groups.
Alpha-Lipoic Acid Reduces Neuroinflammation and Oxidative Stress Induced by Dapsone in an …
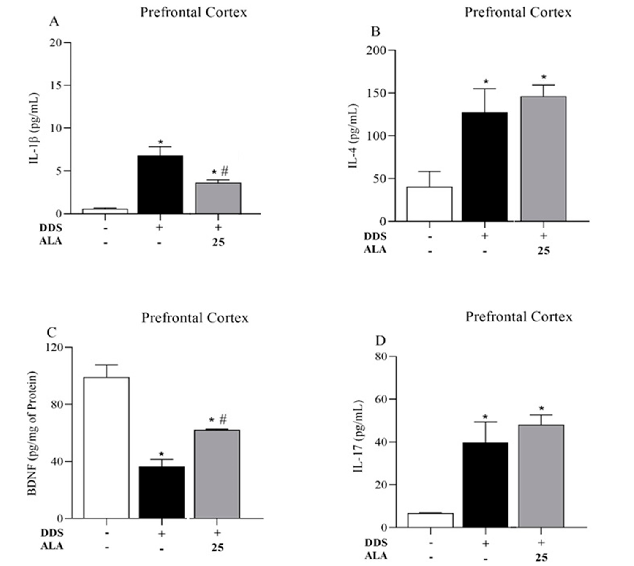
Cytokine levels (IL-1beta, IL-6, and related markers) in prefrontal cortex tissue of dapsone-treated animals, demonstrating alpha-lipoic acid's anti-inflammatory effects.
Alpha-Lipoic Acid Reduces Neuroinflammation and Oxidative Stress Induced by Dapsone in an …
Histological or immunohistochemical analysis of brain tissue from the alpha-lipoic acid and dapsone neuroinflammation study.
Alpha-Lipoic Acid Reduces Neuroinflammation and Oxidative Stress Induced by Dapsone in an …
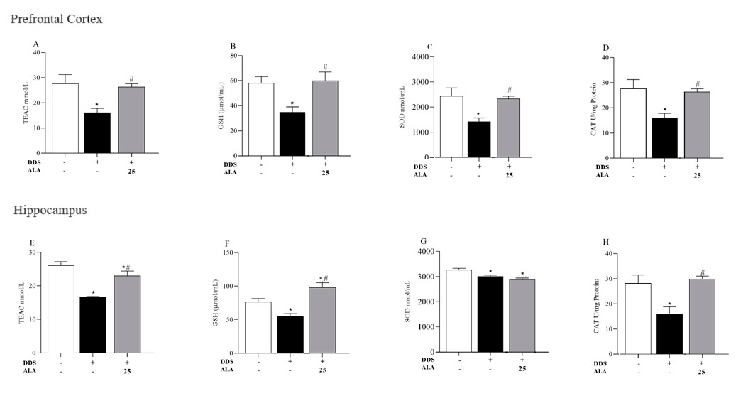
Antioxidant capacity measurements (TEAC, GSH, SOD, and CAT) in prefrontal cortex tissue, showing alpha-lipoic acid's ability to counteract dapsone-induced oxidative stress.
Alpha-Lipoic Acid Reduces Neuroinflammation and Oxidative Stress Induced by Dapsone in an …
Thiobarbituric acid reactive substances (TBARS) measurements indicating lipid peroxidation levels in dapsone-treated animals, with and without alpha-lipoic acid intervention.
Alpha-Lipoic Acid Reduces Neuroinflammation and Oxidative Stress Induced by Dapsone in an …
16페이지 중 14페이지