연구 프로세스
368 동료 심사 연구의 그림
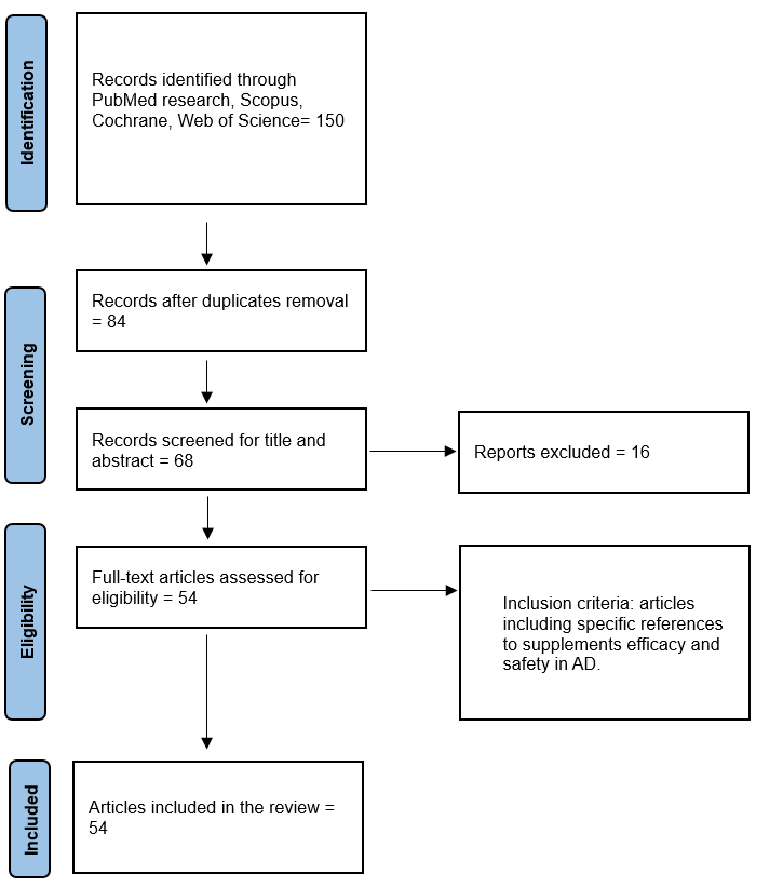
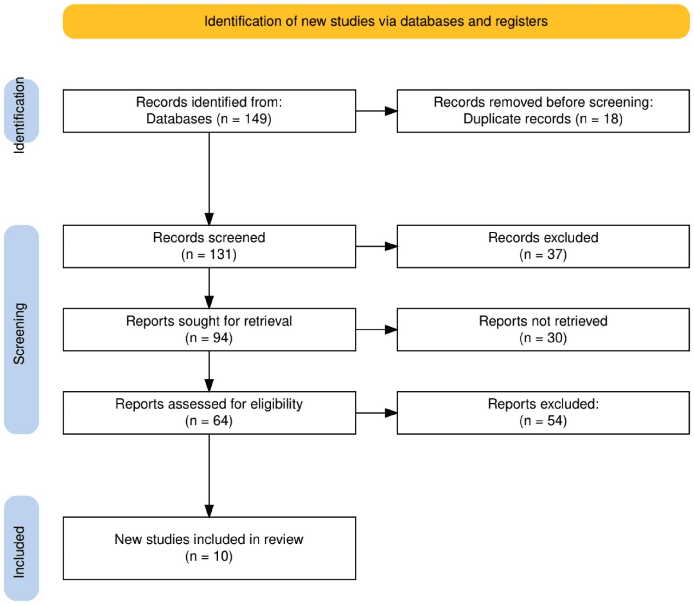
Figure 1. Flow-chart.
Exploring the Efficacy and Safety of Nutritional Supplements in Alzheimer's Disease.
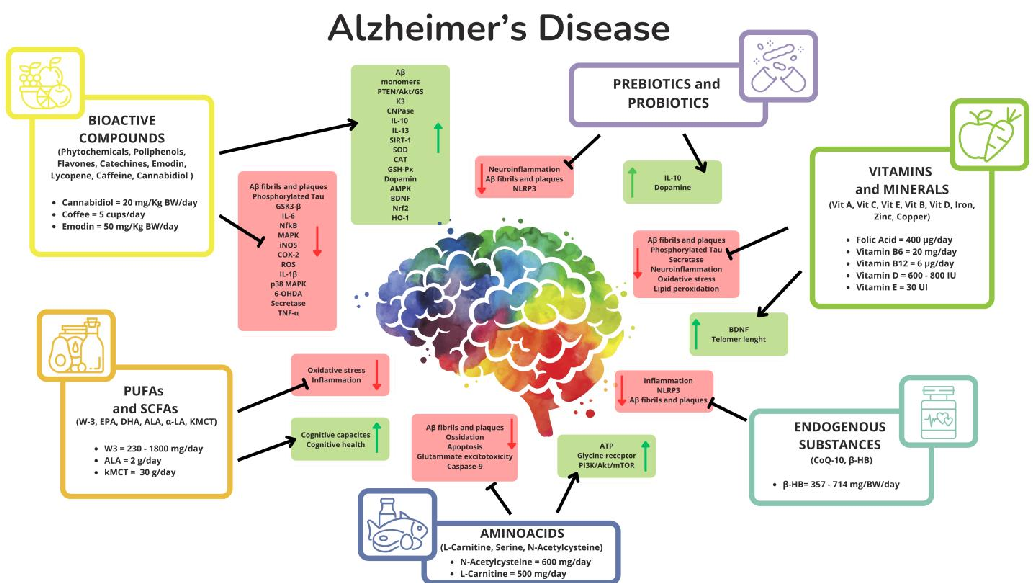
Exploring the Efficacy and Safety of Nutritional Supplements in Alzheimer's Disease.
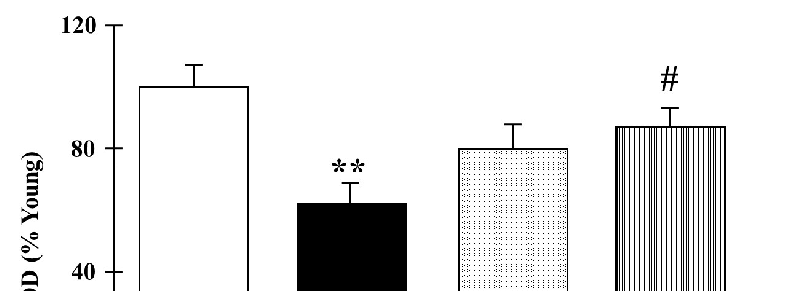
Mitigating Age-Related Cognitive Decline and Oxidative Status in Rats Treated with Catechin …
Mitigating Age-Related Cognitive Decline and Oxidative Status in Rats Treated with Catechin …
The Role of Omega-3 Fatty Acid Supplementation in Slowing Cognitive Decline Among …
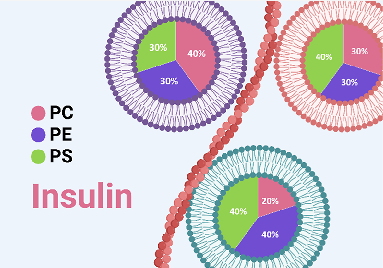
Concentration of Phosphatidylserine Influence Rates of Insulin Aggregation and Toxicity of Amyloid …
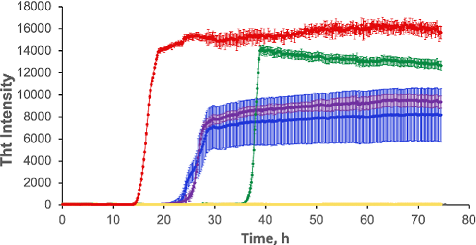
Figure 1. Increase in the concentration of PS in the lipid mixtures increases the aggregation rate of insulin. Averages of triplicates of ThT aggregation kinetics of insulin (Ins) in the …
Concentration of Phosphatidylserine Influence Rates of Insulin Aggregation and Toxicity of Amyloid …
Concentration of Phosphatidylserine Influence Rates of Insulin Aggregation and Toxicity of Amyloid …
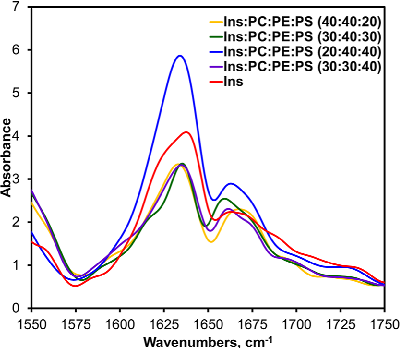
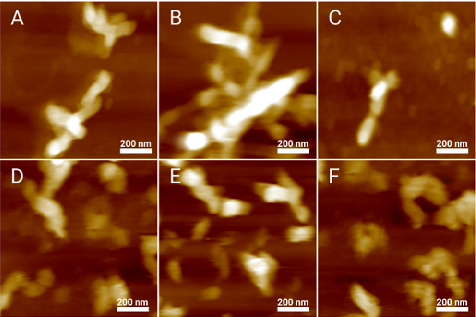
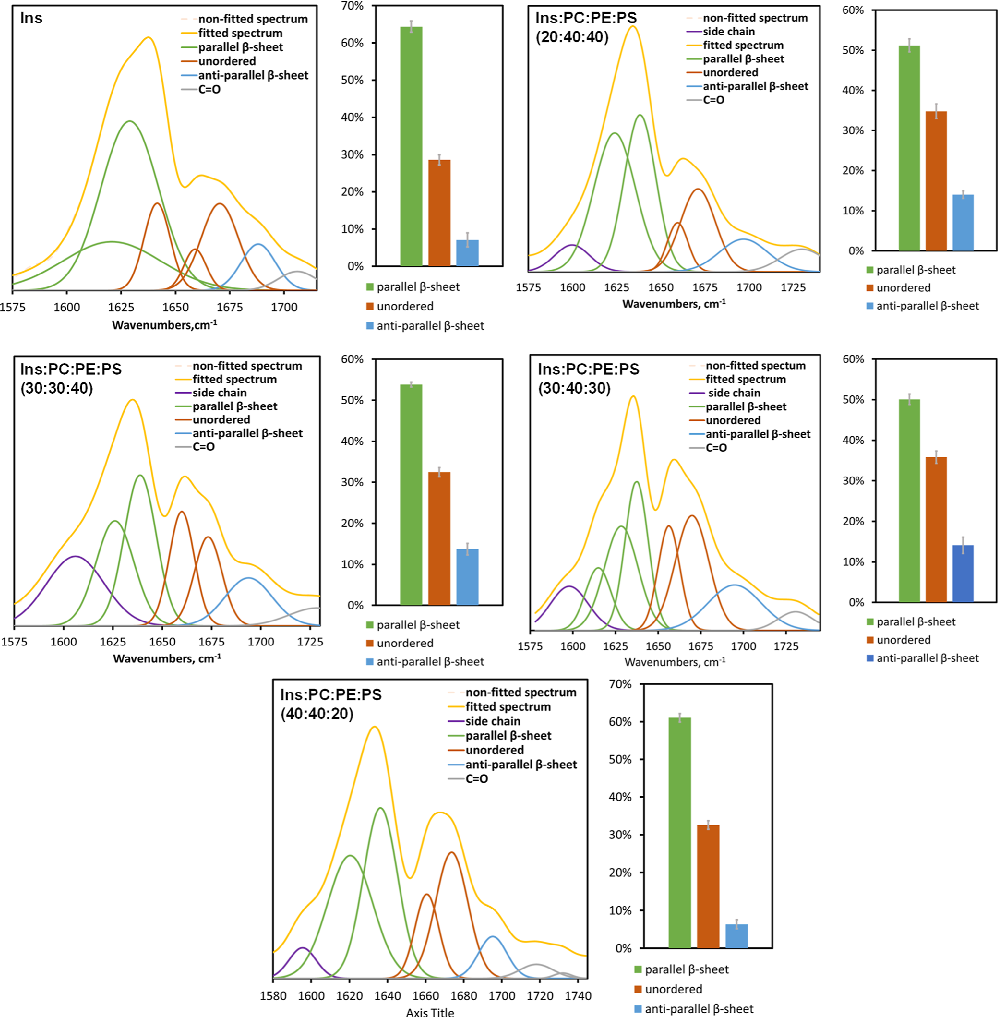
Figure 4. AFM-IR spectra acquired from insulin (Ins) fibrils grown in the lipid-free environment (red), insulin in the presence of LUVs of PC/PE/PS (40:40:20) (yellow), PC/PE/PS (30:40:30) (green), PC/ PE/PS …
Concentration of Phosphatidylserine Influence Rates of Insulin Aggregation and Toxicity of Amyloid …
Concentration of Phosphatidylserine Influence Rates of Insulin Aggregation and Toxicity of Amyloid …
Concentration of Phosphatidylserine Influence Rates of Insulin Aggregation and Toxicity of Amyloid …
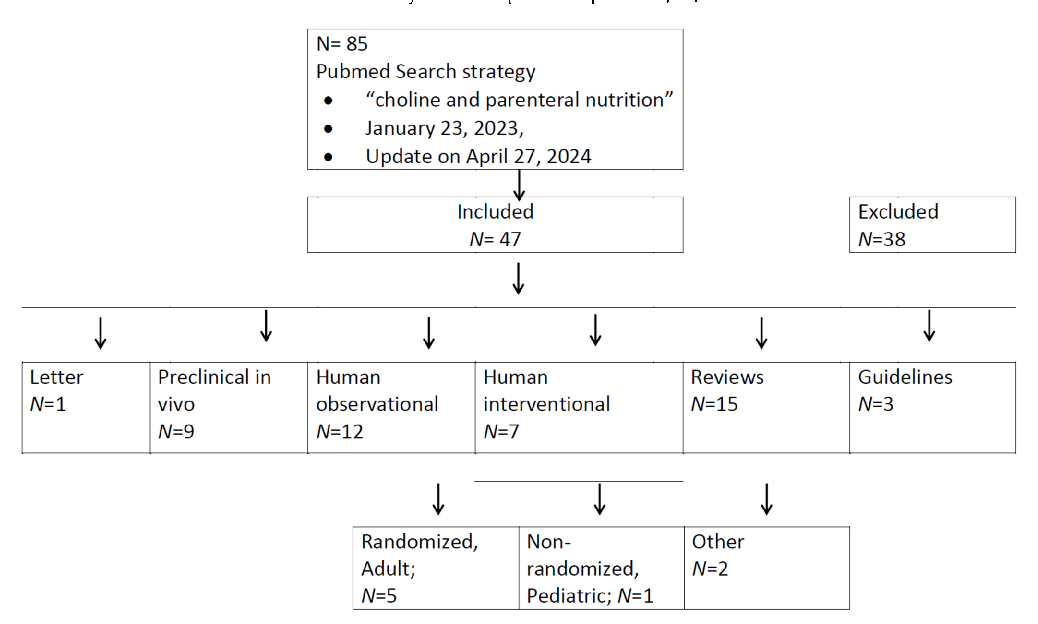
Figure 1. Flow diagram of PubMed search for choline in parenteral nutrition. Please refer to the text for references.
Evidence and Perspectives for Choline Supplementation during Parenteral Nutrition-A Narrative Review.
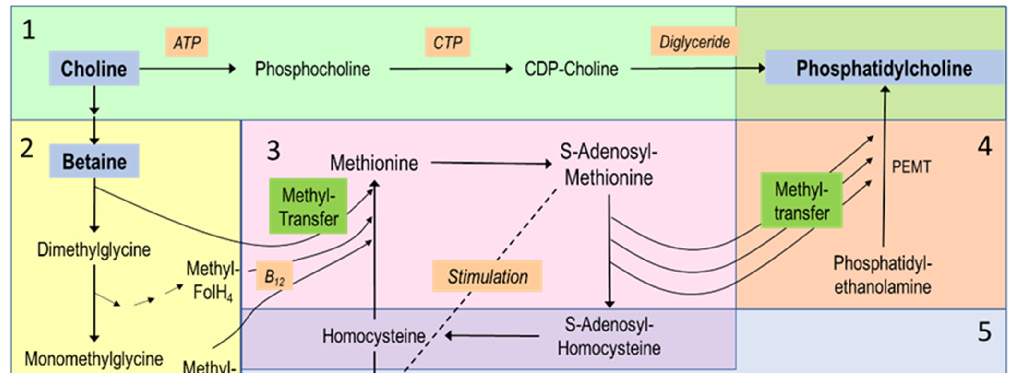
Evidence and Perspectives for Choline Supplementation during Parenteral Nutrition-A Narrative Review.
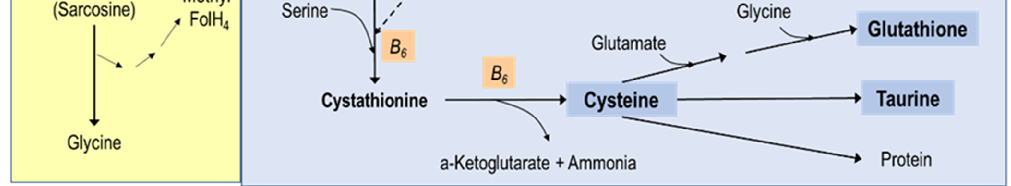
Evidence and Perspectives for Choline Supplementation during Parenteral Nutrition-A Narrative Review.
Evidence and Perspectives for Choline Supplementation during Parenteral Nutrition-A Narrative Review.
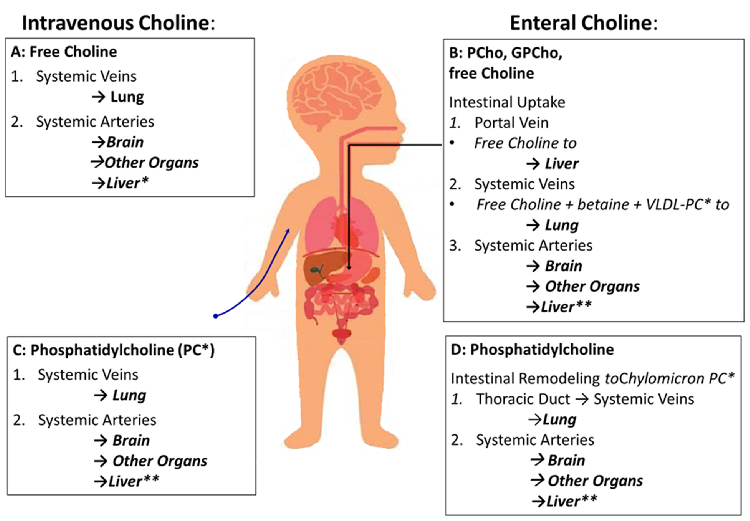
Figure 1. Iron metabolism in the enterocyte and hemochromatosis. (A) Iron is absorbed as Fe2+ through reduction by DcytB/STEAP, and transported via DMT1. In the case iron is bound to …
Metabolic Derangement of Essential Transition Metals and Potential Antioxidant Therapies.
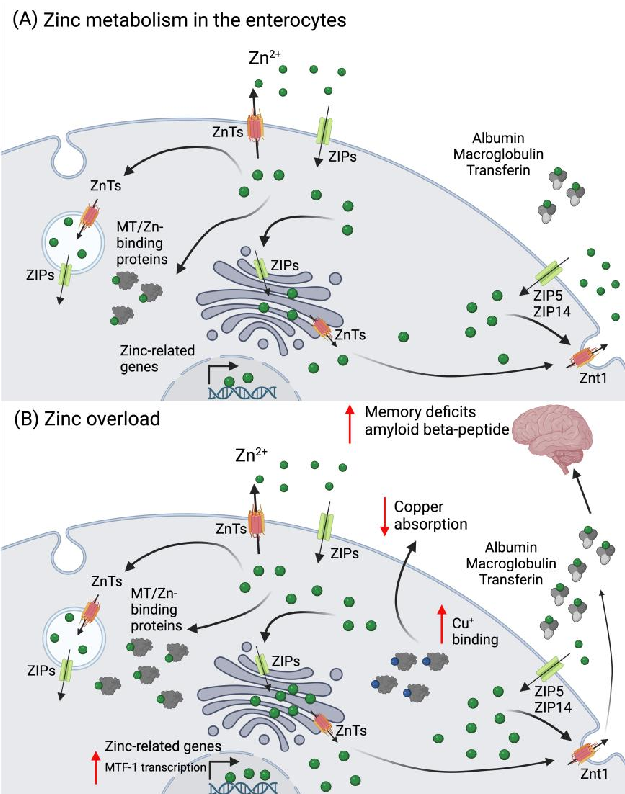
Figure 2. Zinc metabolism in the enterocyte and its overload. (A) Zinc is absorbed as Zn2+ via the ZIPs (mainly ZIP4) and can be excreted into the intestinal lumen by …
Metabolic Derangement of Essential Transition Metals and Potential Antioxidant Therapies.
Metabolic Derangement of Essential Transition Metals and Potential Antioxidant Therapies.
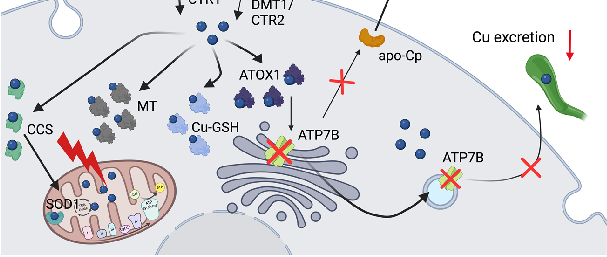
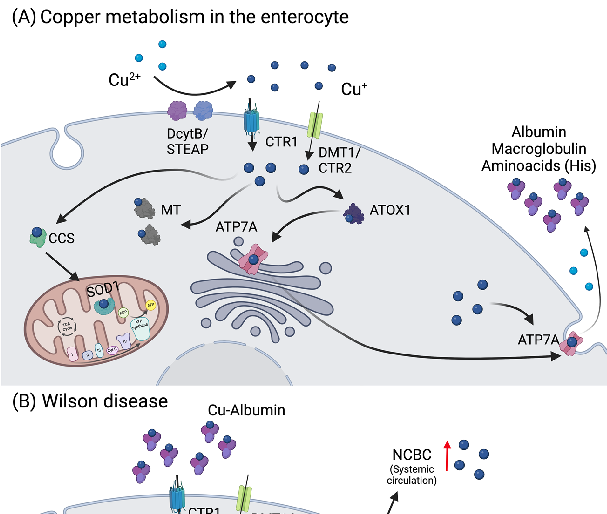
Figure 3. Copper metabolism in the enterocytes and Wilson disease. (A) Copper is reduced to Cu+ by STEAP or DcytB, and transported mainly via CTR1, but also by DMT1/CTR2. Thereupon,
Metabolic Derangement of Essential Transition Metals and Potential Antioxidant Therapies.
Metabolic Derangement of Essential Transition Metals and Potential Antioxidant Therapies.
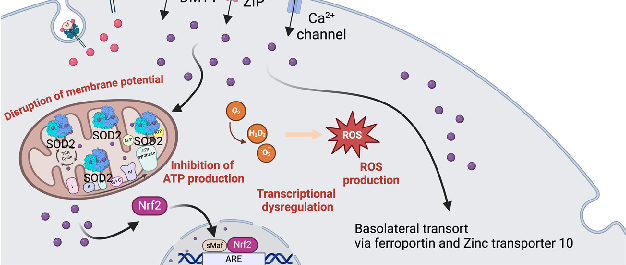
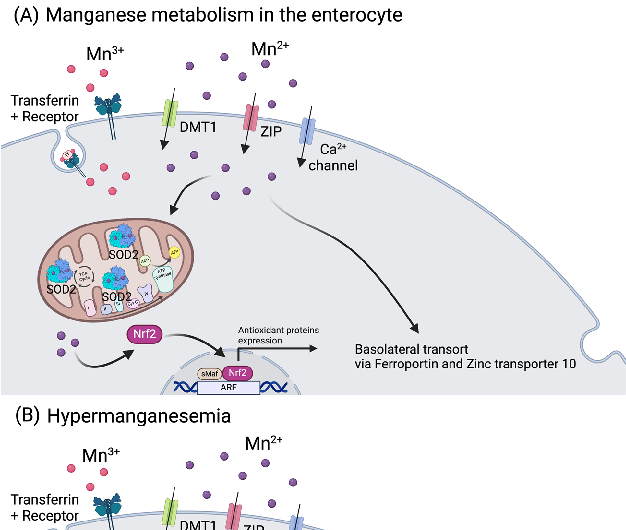
Figure 4. Manganese metabolism and hypermanganesemia. (A) Manganese can be taken up as Mn2+ via DMT1, ZIP, or Ca2+ channels, or as Mn3+ by binding to transferrin. In mitochondria, Mn2+ …
Metabolic Derangement of Essential Transition Metals and Potential Antioxidant Therapies.
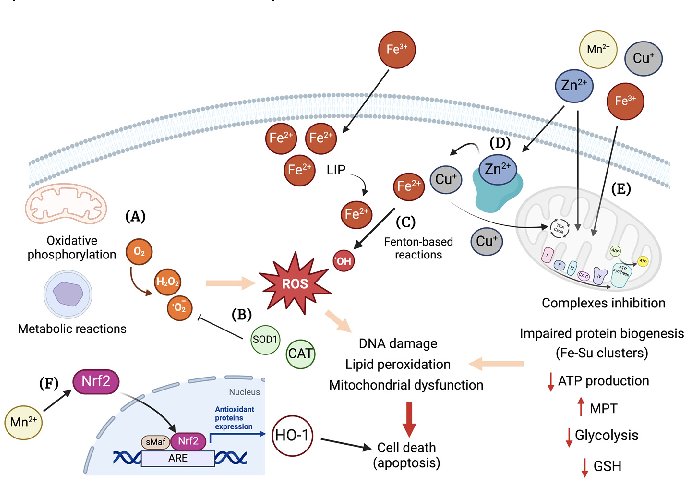
Figure 5. Overview of cellular mechanisms related to toxicity by essential transition metals. (A) Different metabolic pathways in the cell use O2, e.g., oxidative phosphorylation in the mitochondria. The generation …
Metabolic Derangement of Essential Transition Metals and Potential Antioxidant Therapies.
Metabolic Derangement of Essential Transition Metals and Potential Antioxidant Therapies.
Metabolic Derangement of Essential Transition Metals and Potential Antioxidant Therapies.
16페이지 중 15페이지