Resveratrol Figuras
5 figuras de pesquisa revisada por pares
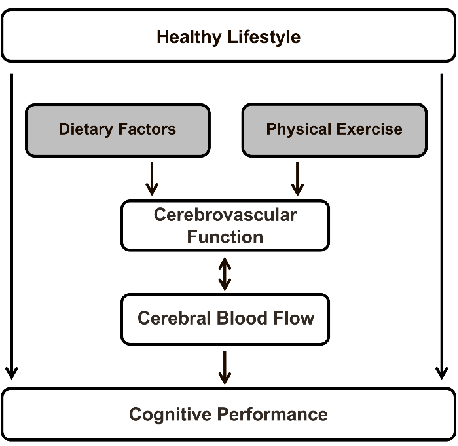
A schematic overview maps the relationships between dietary factors — including nitrate, polyphenols, fatty acids, and caffeine — and their effects on cerebral blood flow, integrating evidence from neuroimaging studies.
Cerebral Blood Flow Measurements in Adults: A Review on the Effects of …
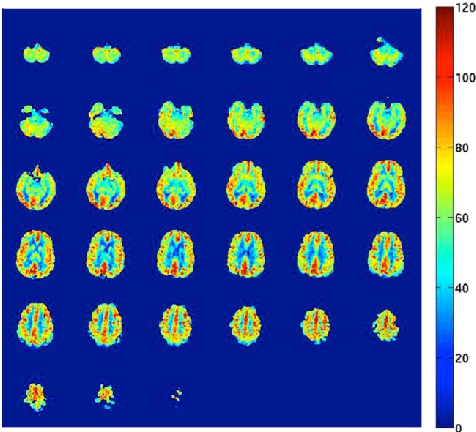
An arterial spin labeling cerebral blood flow map displays regional perfusion in units of milliliters per 100 grams of brain tissue per minute, illustrating the spatial distribution of blood flow across cortical regions.
Cerebral Blood Flow Measurements in Adults: A Review on the Effects of …
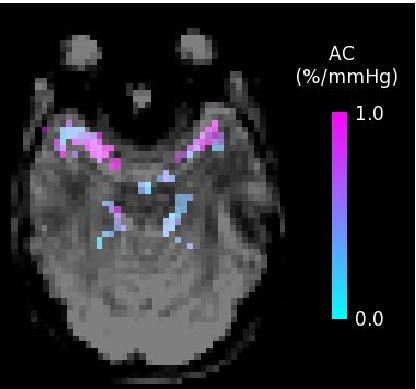
An arterial compliance map shows the percentage change in arterial blood volume per millimeter of mercury, obtained using short inversion time arterial spin labeling to assess cerebrovascular reactivity.
Cerebral Blood Flow Measurements in Adults: A Review on the Effects of …
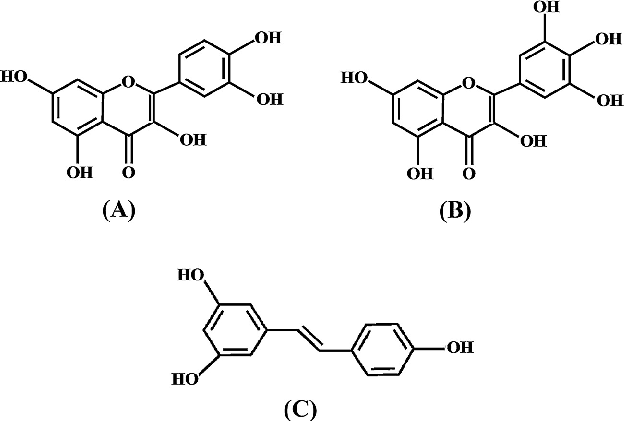
Molecular mechanisms by which red grape polyphenols exert antidiabetic effects are illustrated, including modulation of insulin signaling, glucose uptake, and oxidative stress pathways.
Role of red grape polyphenols as antidiabetic agents.
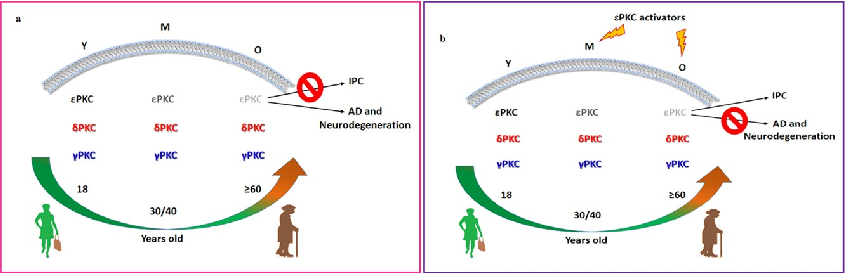
Schematic representation of PKC isoform and RACK protein distribution in membrane fractions of young versus aged rat hippocampus illustrates the age-dependent loss of neuroprotective mechanisms.
Age-Dependent Levels of Protein Kinase Cs in Brain: Reduction of Endogenous Mechanisms …