研究プロセス
368 査読済み研究からの図表
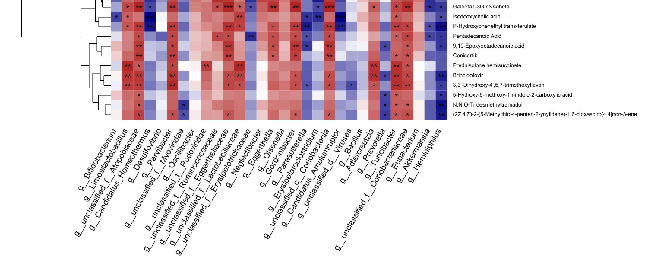
Quantification of gut permeability markers or short-chain fatty acid concentrations in fecal samples from experimental groups. Butyrate, propionate, and acetate levels are compared to assess the metabolic impact of Ginkgo biloba on the gut environment.
Ginkgo biloba Extract Drives Gut Flora and Microbial Metabolism Variation in a …
Comprehensive summary model proposing the mechanism by which Ginkgo biloba extract ameliorates Alzheimer's disease symptoms through modulation of the brain-gut axis, gut flora remodeling, and microbial metabolite signaling.
Ginkgo biloba Extract Drives Gut Flora and Microbial Metabolism Variation in a …
g r a p h i c a l a b s t r a c t
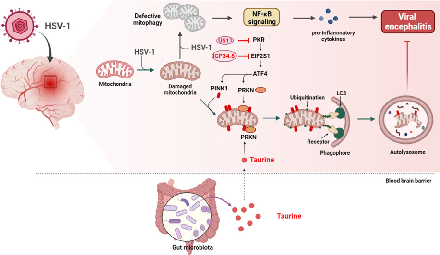
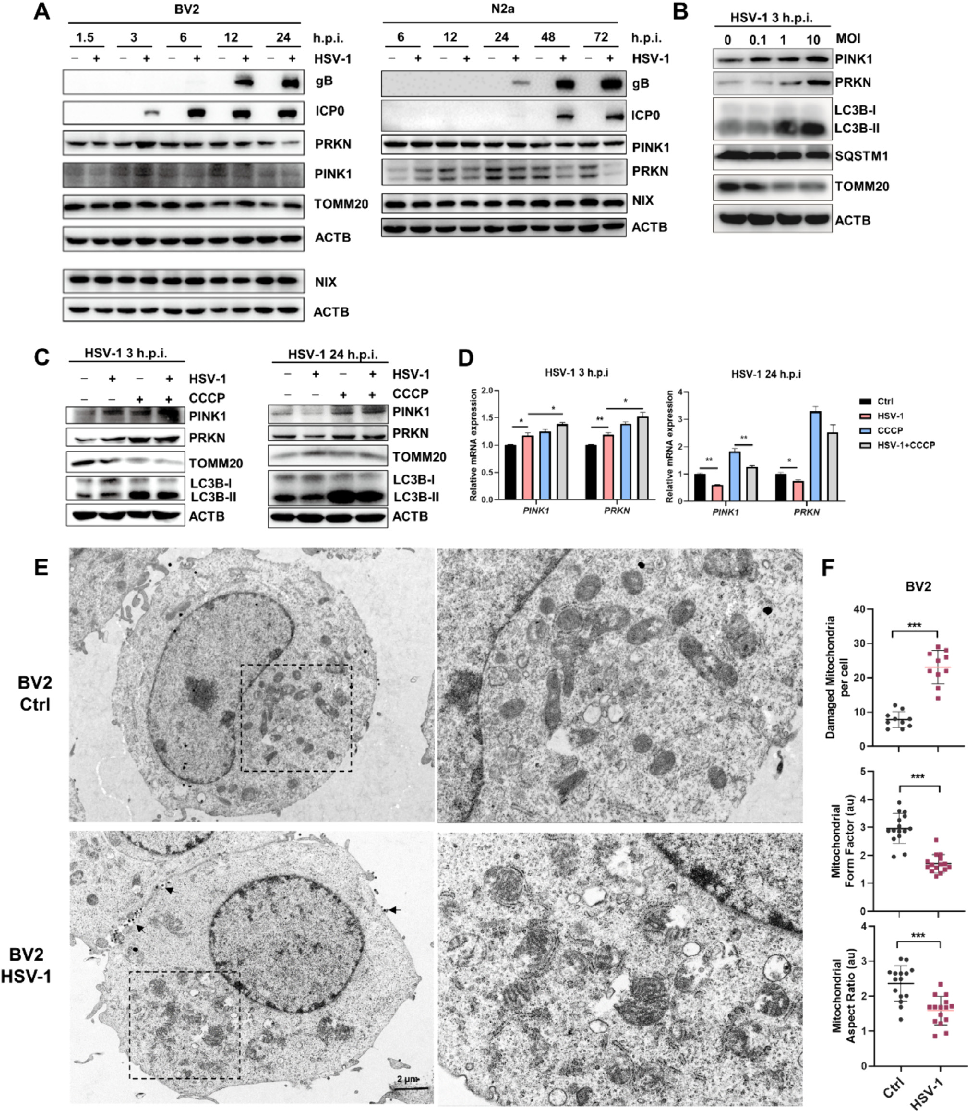
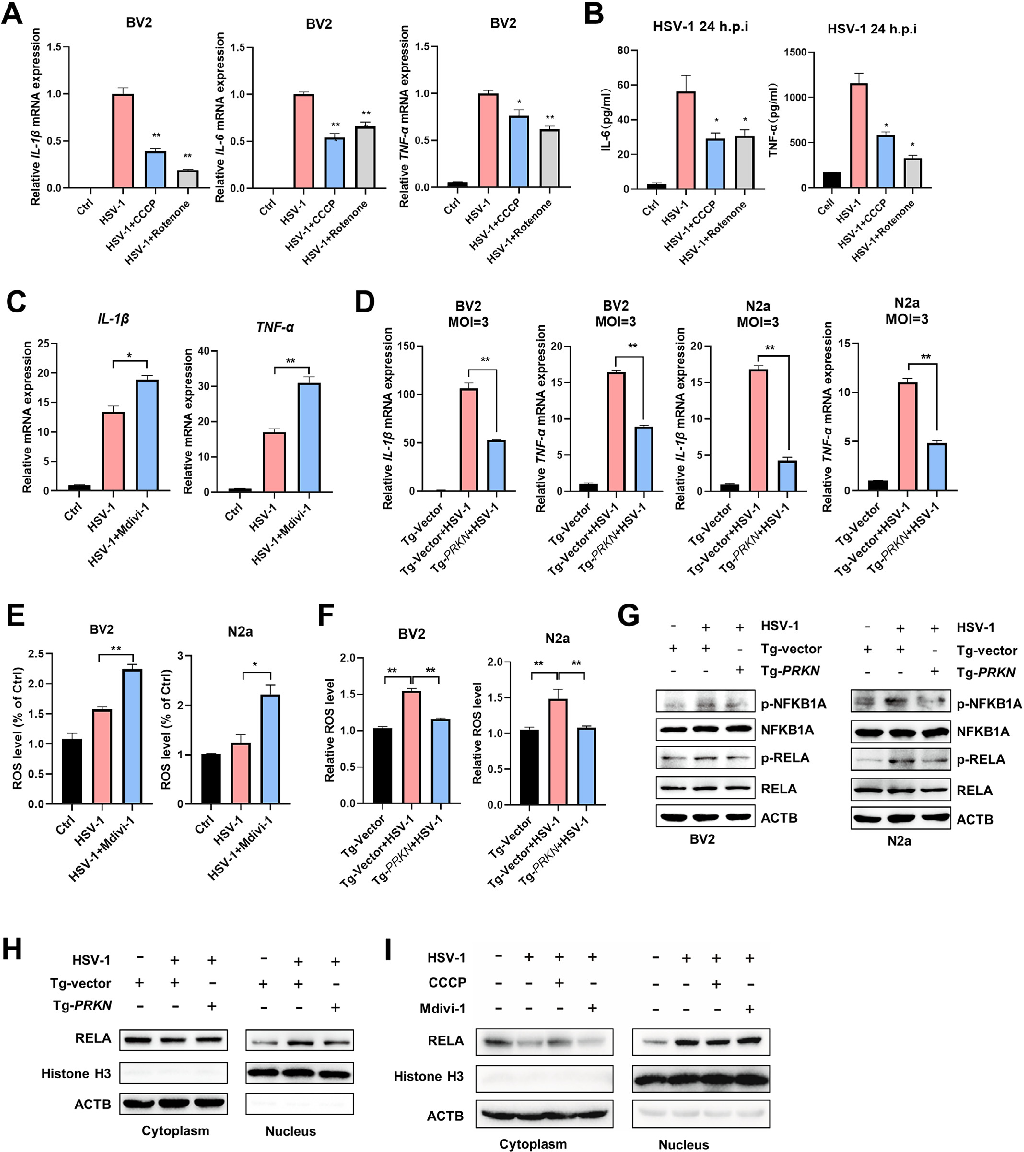
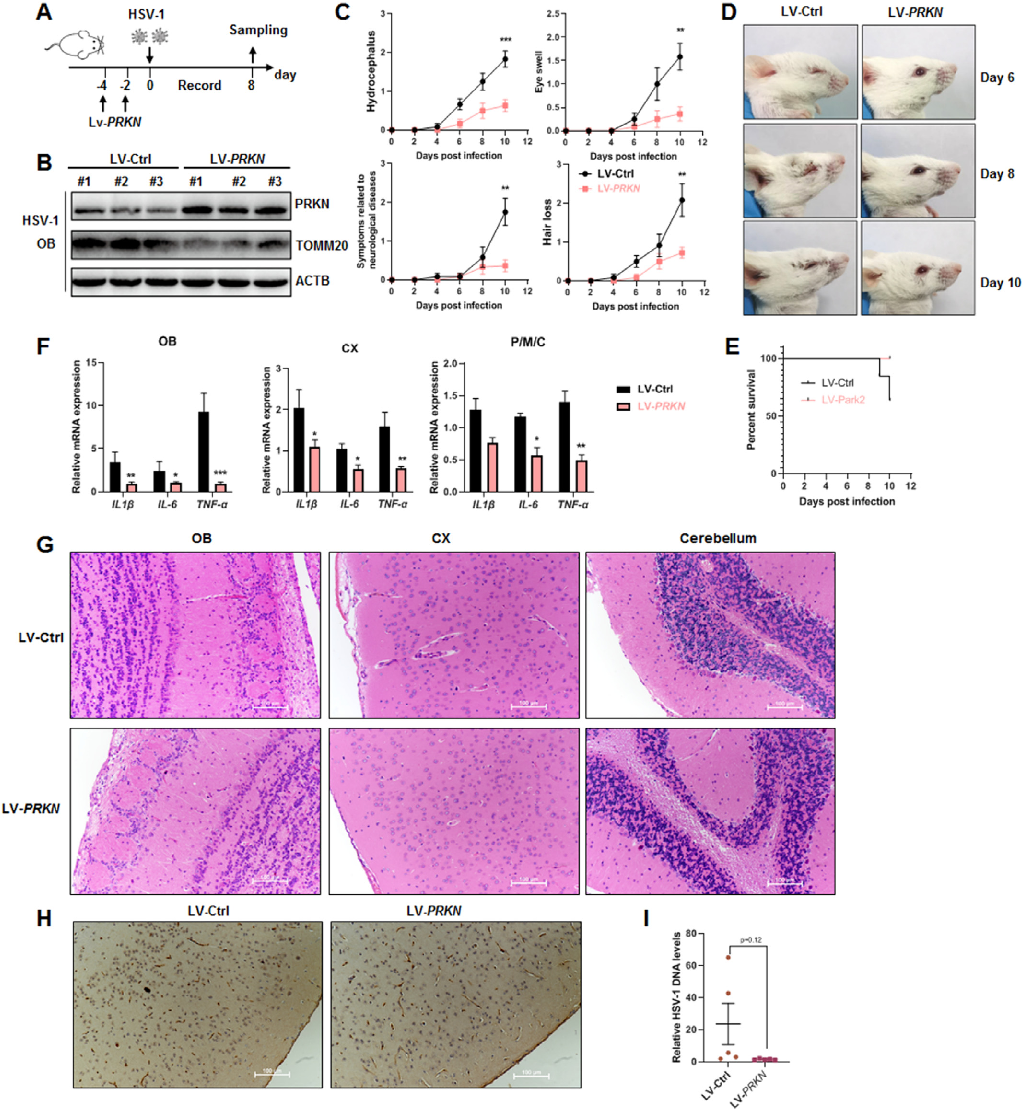
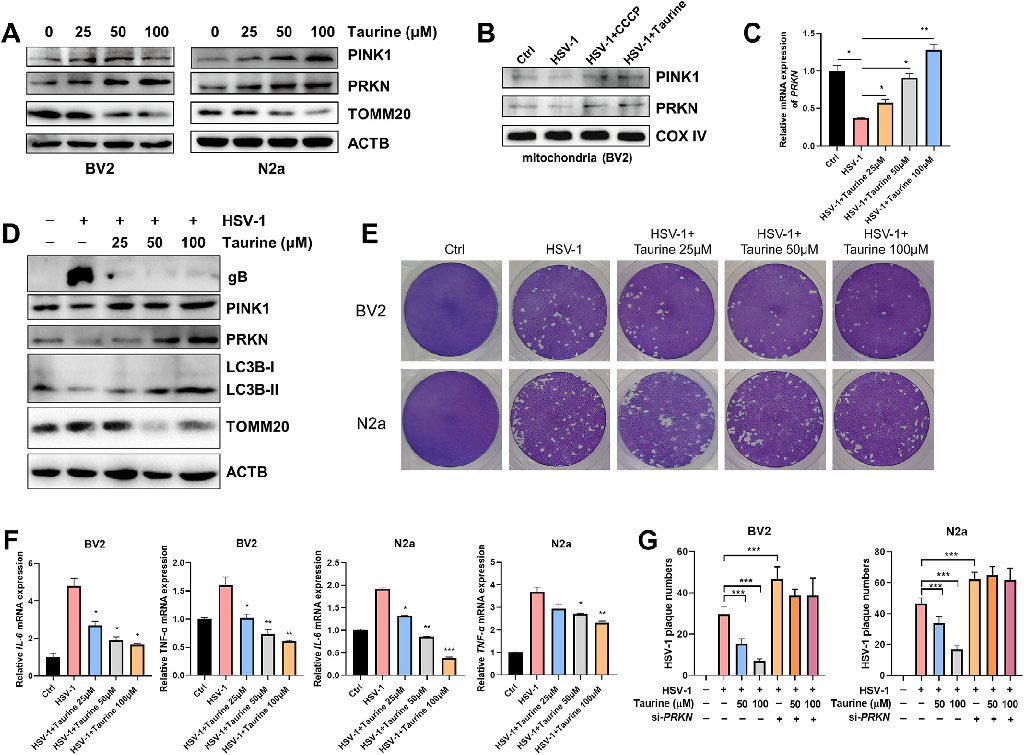
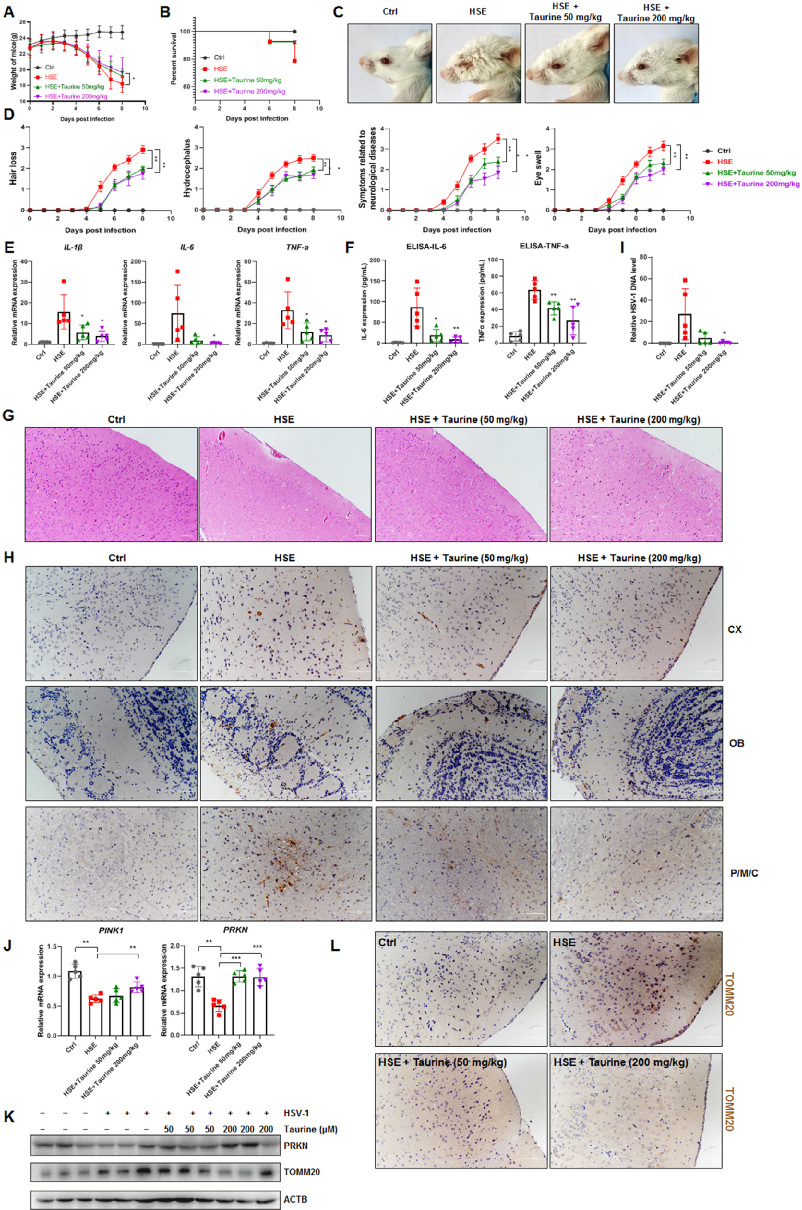
Inhibition of mitophagy via the EIF2S1-ATF4-PRKN pathway contributes to viral encephalitis.
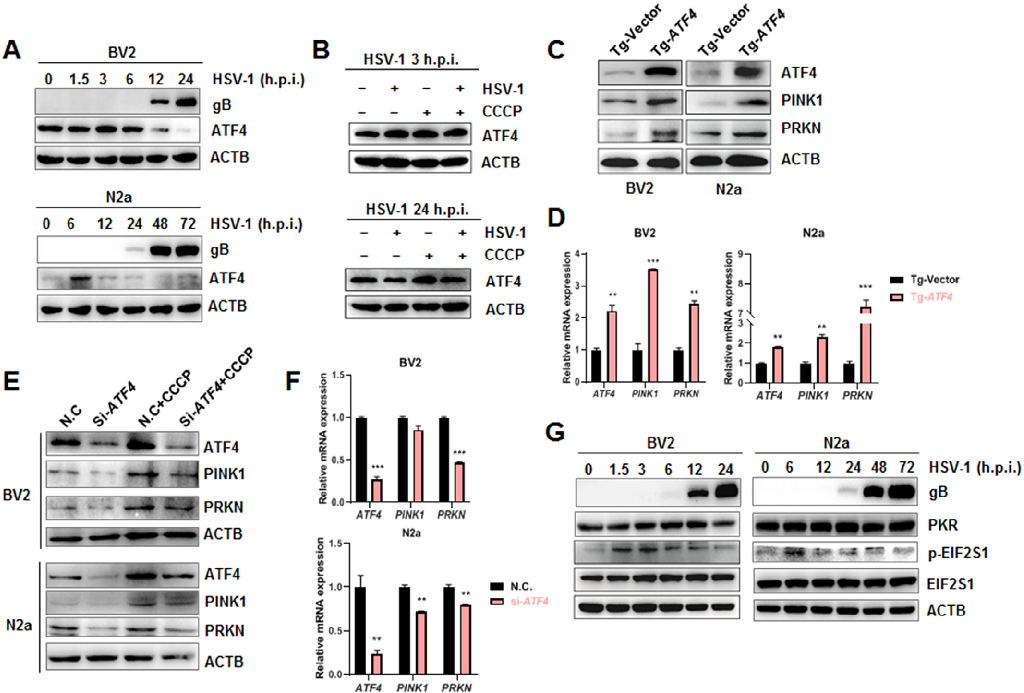
Inhibition of mitophagy via the EIF2S1-ATF4-PRKN pathway contributes to viral encephalitis.
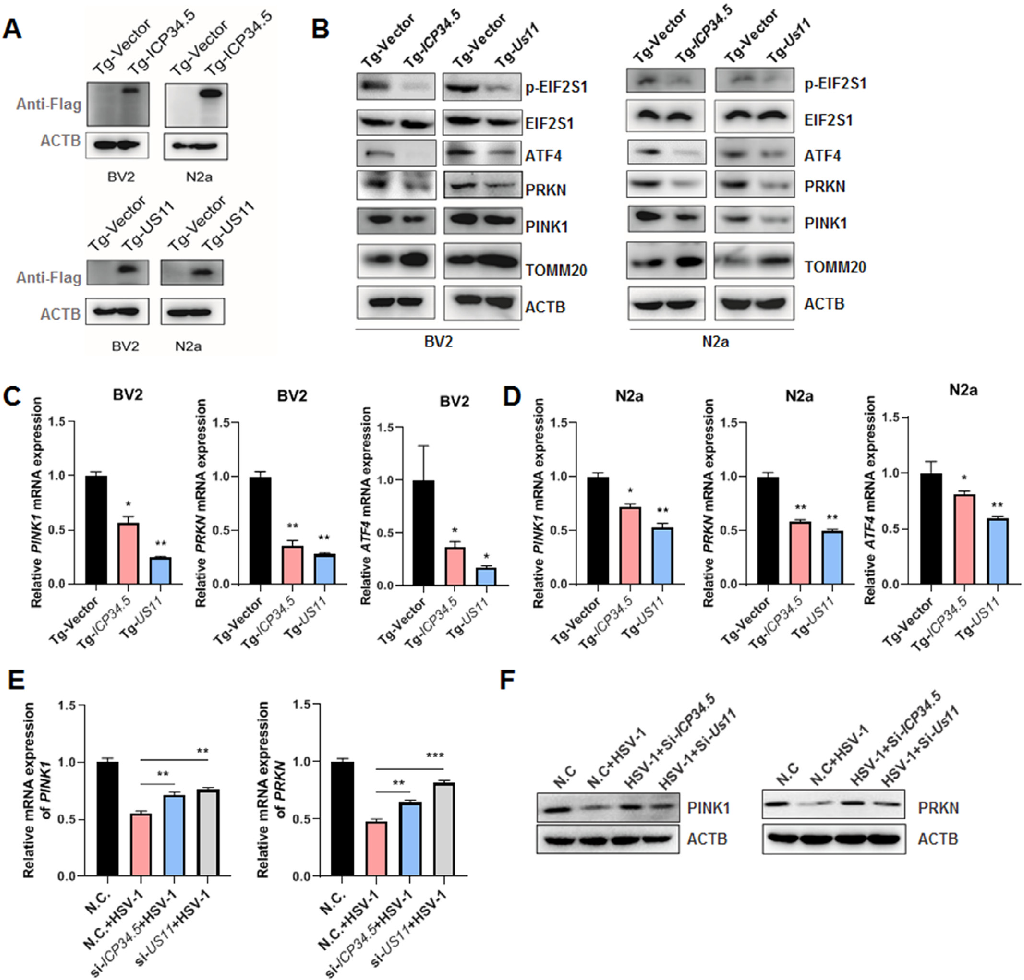
Inhibition of mitophagy via the EIF2S1-ATF4-PRKN pathway contributes to viral encephalitis.
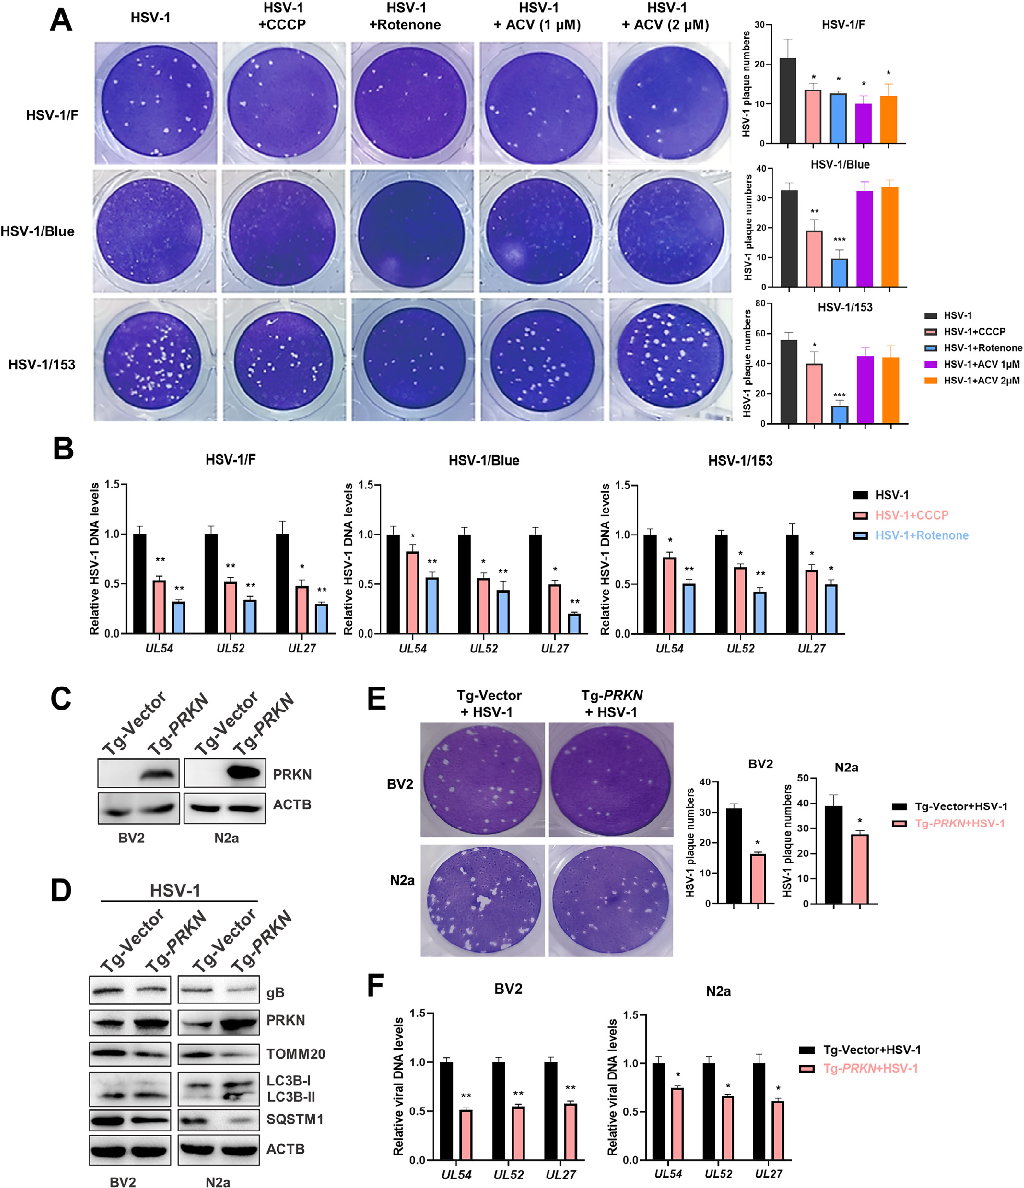
Inhibition of mitophagy via the EIF2S1-ATF4-PRKN pathway contributes to viral encephalitis.
Inhibition of mitophagy via the EIF2S1-ATF4-PRKN pathway contributes to viral encephalitis.
Inhibition of mitophagy via the EIF2S1-ATF4-PRKN pathway contributes to viral encephalitis.
Inhibition of mitophagy via the EIF2S1-ATF4-PRKN pathway contributes to viral encephalitis.
Inhibition of mitophagy via the EIF2S1-ATF4-PRKN pathway contributes to viral encephalitis.
Inhibition of mitophagy via the EIF2S1-ATF4-PRKN pathway contributes to viral encephalitis.
Inhibition of mitophagy via the EIF2S1-ATF4-PRKN pathway contributes to viral encephalitis.
Various nanoparticle-based drug delivery systems designed to cross the blood-brain barrier are depicted, including liposomes, polymeric nanoparticles, and solid lipid carriers for Alzheimer's disease therapeutics.
Latest Perspectives on Alzheimer's Disease Treatment: The Role of Blood-Brain Barrier and …
Antioxidant mechanisms relevant to Alzheimer's disease neuroprotection are summarized, highlighting how reactive oxygen species contribute to neurodegeneration and how antioxidant-loaded delivery systems may counteract oxidative damage.
Latest Perspectives on Alzheimer's Disease Treatment: The Role of Blood-Brain Barrier and …
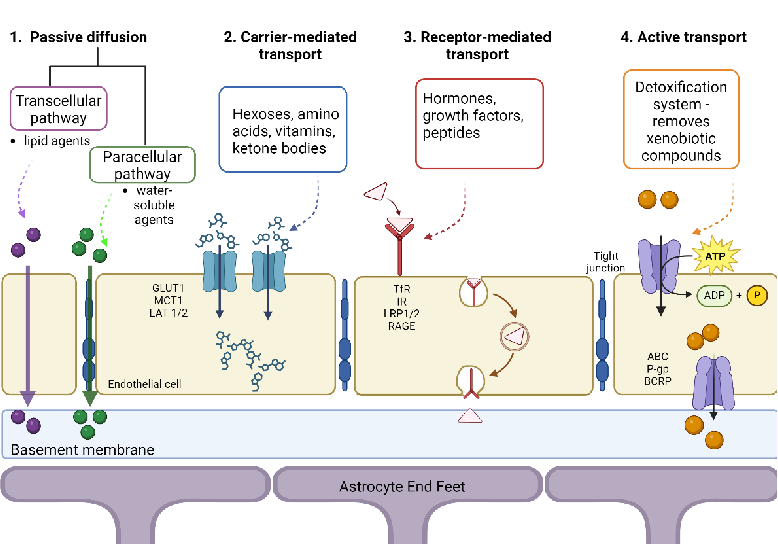
A comparative overview of different blood-brain barrier crossing strategies is presented, including receptor-mediated transcytosis, adsorptive transcytosis, and focused ultrasound approaches for drug delivery.
Latest Perspectives on Alzheimer's Disease Treatment: The Role of Blood-Brain Barrier and …
A schematic timeline of Alzheimer's disease progression alongside potential intervention windows for antioxidant and BBB-targeting drug delivery systems is shown, emphasizing early intervention strategies.
Latest Perspectives on Alzheimer's Disease Treatment: The Role of Blood-Brain Barrier and …
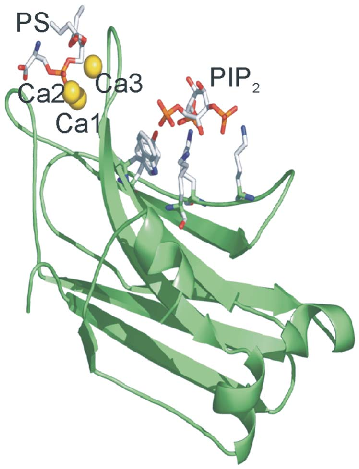
The crystal structure of the PKCα C2 domain bound to calcium, phosphatidylserine, and PIP2 in a quaternary complex is rendered, showing the spatial arrangement of lipid-binding sites.
Phosphatidylinositol 4,5-bisphosphate decreases the concentration of Ca2+, phosphatidylserine and diacylglycerol required for …
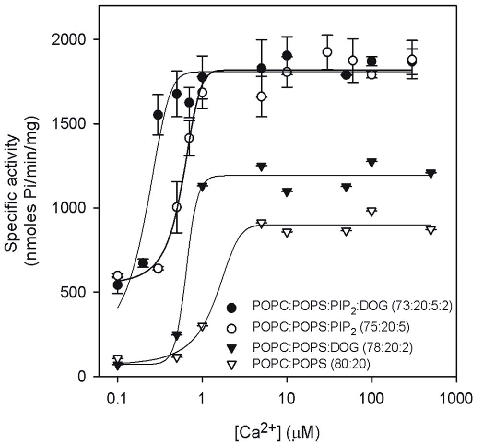
PKCα enzymatic activity is plotted as a function of calcium concentration, demonstrating how PIP2 reduces the calcium requirement for maximal kinase activation.
Phosphatidylinositol 4,5-bisphosphate decreases the concentration of Ca2+, phosphatidylserine and diacylglycerol required for …
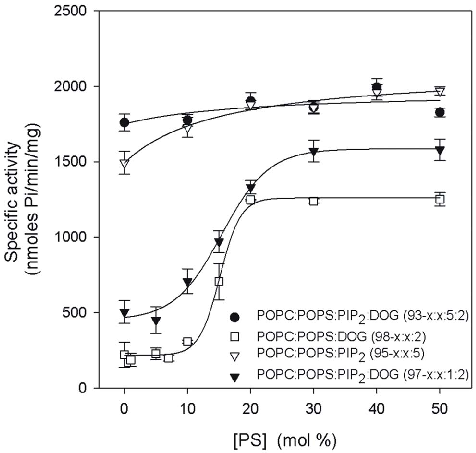
The dependence of PKCα activity on phosphatidylserine (POPS) concentration in lipid vesicles reveals that PIP2 lowers the threshold of phosphatidylserine needed for enzyme activation.
Phosphatidylinositol 4,5-bisphosphate decreases the concentration of Ca2+, phosphatidylserine and diacylglycerol required for …
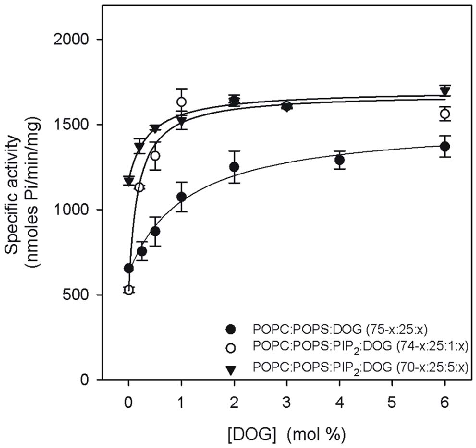
PKCα activity is shown as a function of diacylglycerol (DOG) molar percentage in lipid vesicles, illustrating the cofactor requirements for kinase activation.
Phosphatidylinositol 4,5-bisphosphate decreases the concentration of Ca2+, phosphatidylserine and diacylglycerol required for …
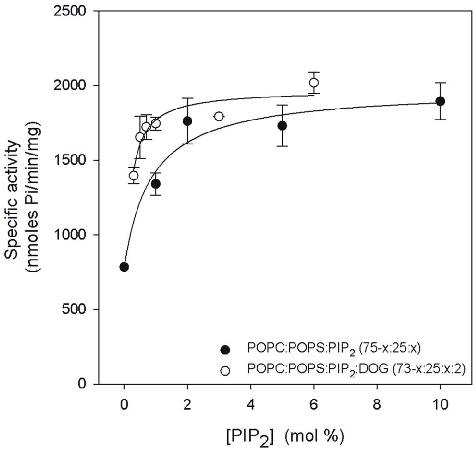
The relationship between PIP2 concentration and PKCα activity demonstrates that increasing PIP2 in lipid vesicles progressively enhances kinase activation efficiency.
Phosphatidylinositol 4,5-bisphosphate decreases the concentration of Ca2+, phosphatidylserine and diacylglycerol required for …
Immunotherapy of Mild Cognitive Impairment by ω-3 Supplementation: Why Are Amyloid-β Antibodies …
Immunotherapy of Mild Cognitive Impairment by ω-3 Supplementation: Why Are Amyloid-β Antibodies …
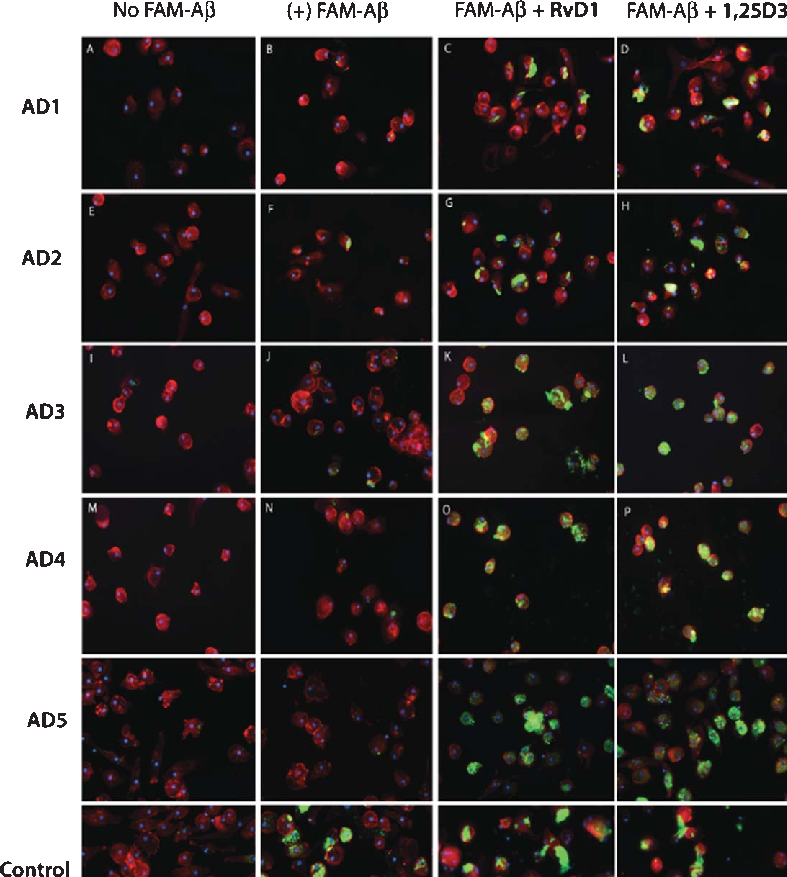
Immunotherapy of Mild Cognitive Impairment by ω-3 Supplementation: Why Are Amyloid-β Antibodies …
16ページ中8ページ目