研究プロセス
368 査読済み研究からの図表
Immunotherapy of Mild Cognitive Impairment by ω-3 Supplementation: Why Are Amyloid-β Antibodies …
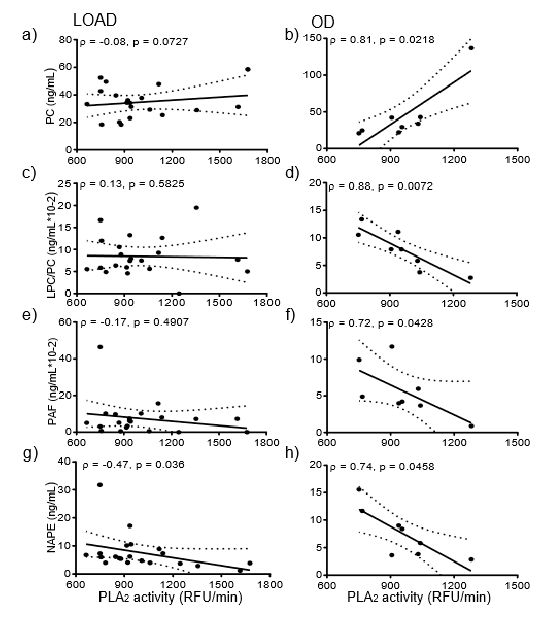
Correlation analysis between PLA2 activity and glycerophospholipid levels in Alzheimer's disease patients reveals no significant association, suggesting independent dysregulation pathways.
Lipid Metabolism in Late-Onset Alzheimer's Disease Differs from Patients Presenting with Other …
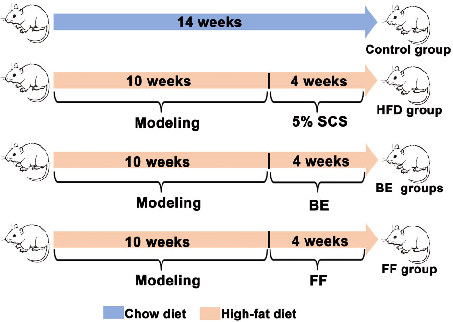
The experimental design outlines the group allocation including sodium carboxymethyl cellulose control, berberine-evodiamine combination, and fenofibrate positive control arms.
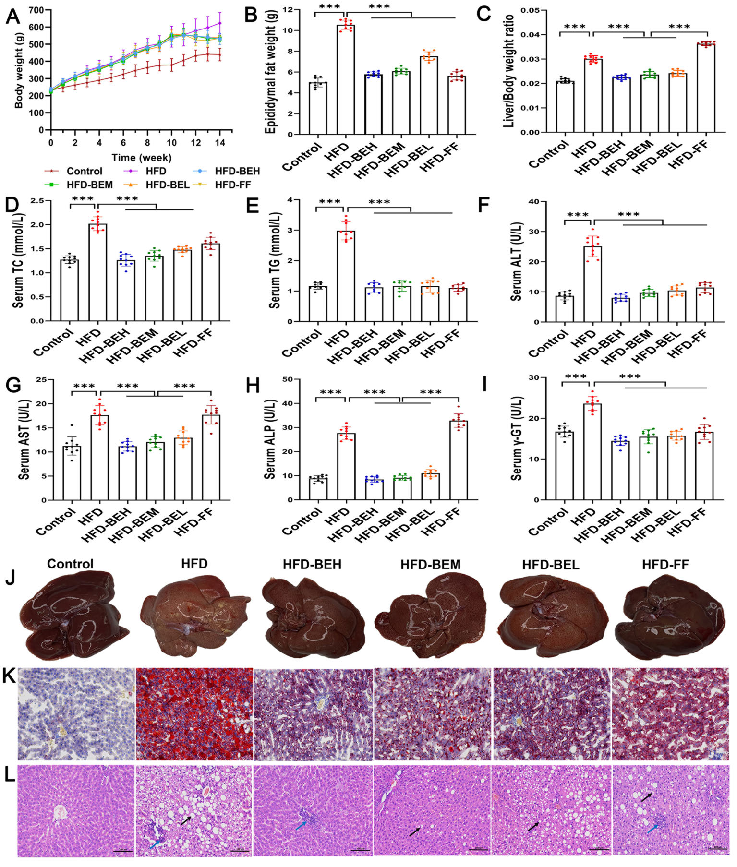
The combination of berberine and evodiamine ameliorates high-fat diet-induced non-alcoholic fatty liver …
Gut microbiota composition analyzed by 16S rRNA sequencing reveals distinct community structures across treatment groups, with the combination therapy restoring microbial diversity.
The combination of berberine and evodiamine ameliorates high-fat diet-induced non-alcoholic fatty liver …
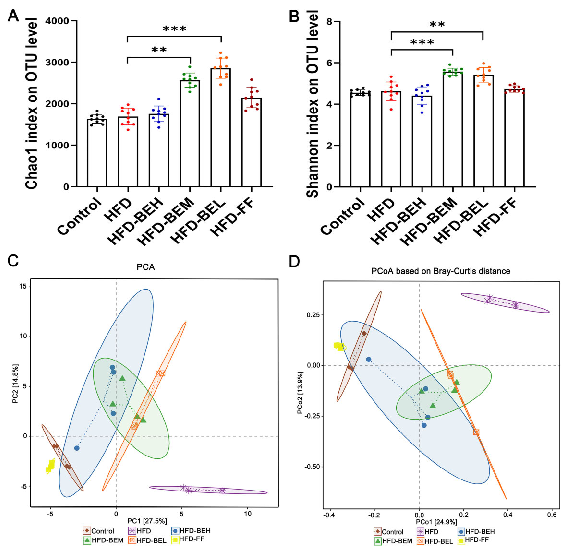
Alpha diversity indices of gut microbiota are compared across groups, indicating that berberine and evodiamine co-administration partially reverses high-fat diet-induced dysbiosis.
The combination of berberine and evodiamine ameliorates high-fat diet-induced non-alcoholic fatty liver …
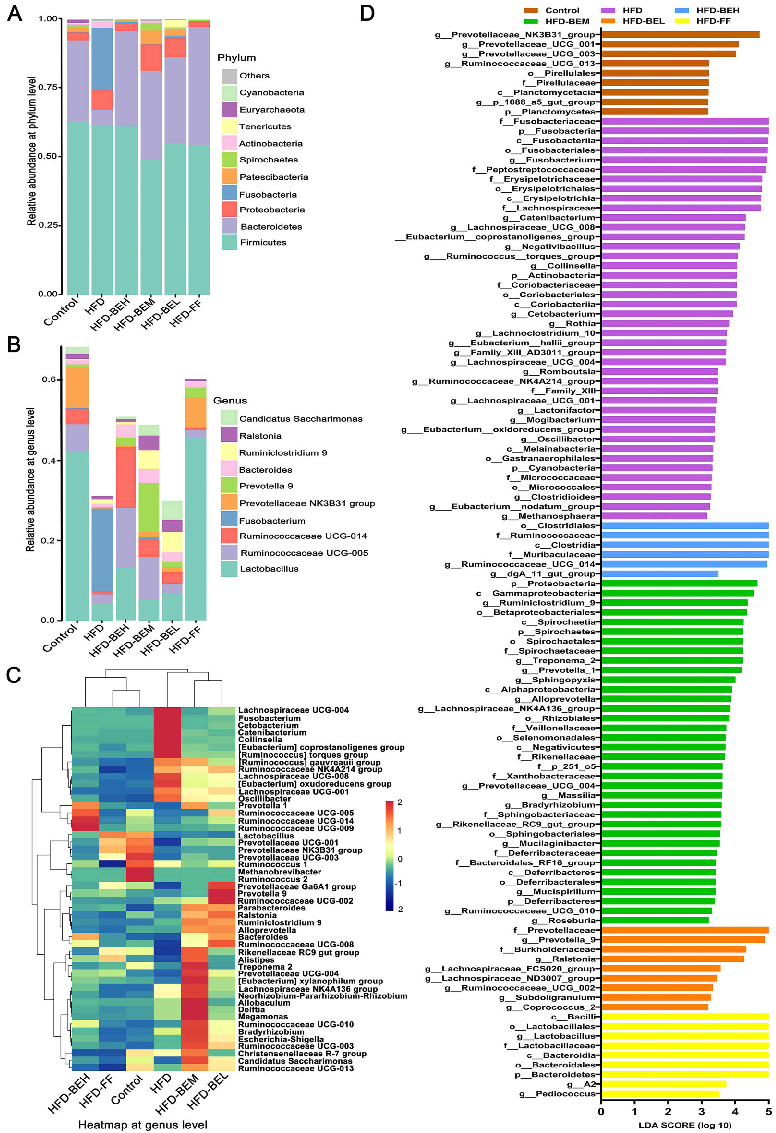
Key bacterial taxa differentially abundant between treatment groups are identified, with specific genera associated with improved metabolic outcomes in the combination therapy arm.
The combination of berberine and evodiamine ameliorates high-fat diet-induced non-alcoholic fatty liver …
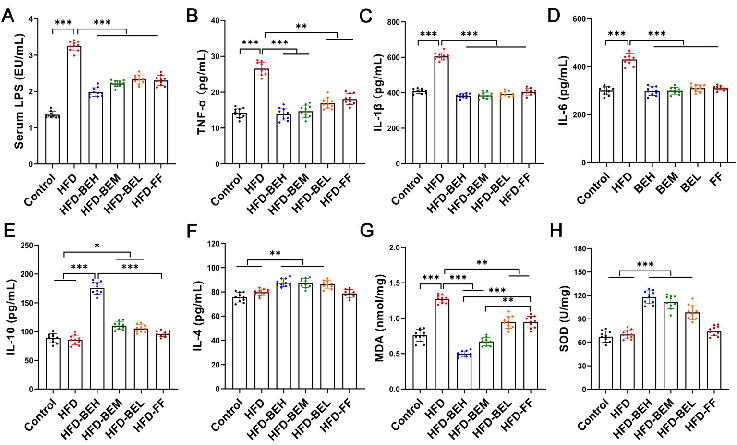
Short-chain fatty acid concentrations in fecal samples reflect changes in microbial metabolic activity following berberine and evodiamine treatment.
The combination of berberine and evodiamine ameliorates high-fat diet-induced non-alcoholic fatty liver …
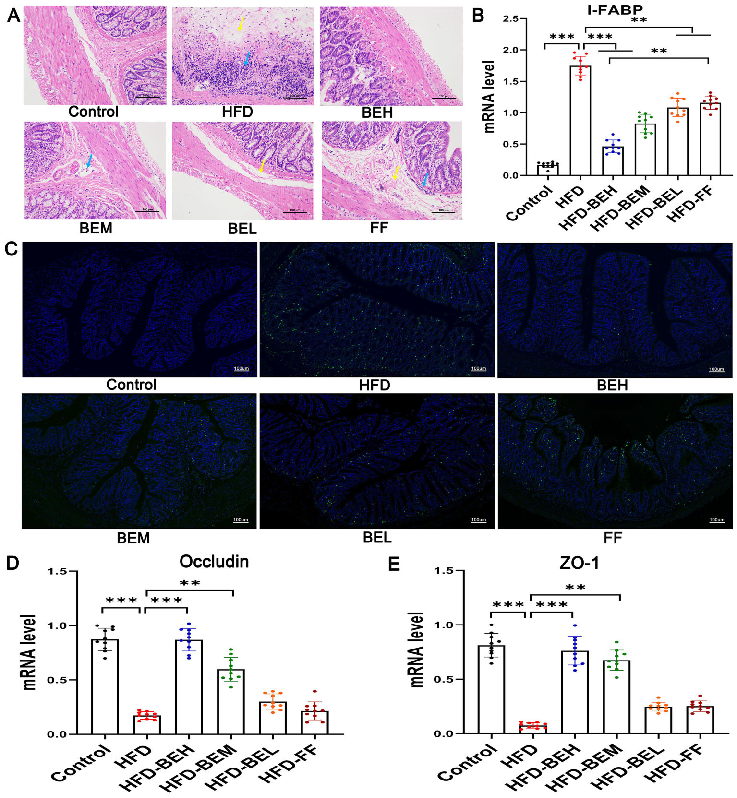
Correlation analysis between gut microbiota composition and hepatic lipid parameters links specific bacterial taxa to the amelioration of non-alcoholic fatty liver disease.
The combination of berberine and evodiamine ameliorates high-fat diet-induced non-alcoholic fatty liver …
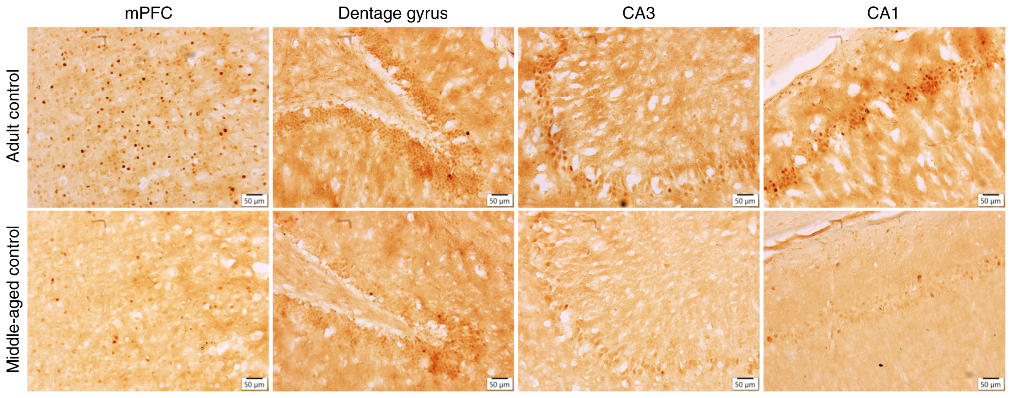
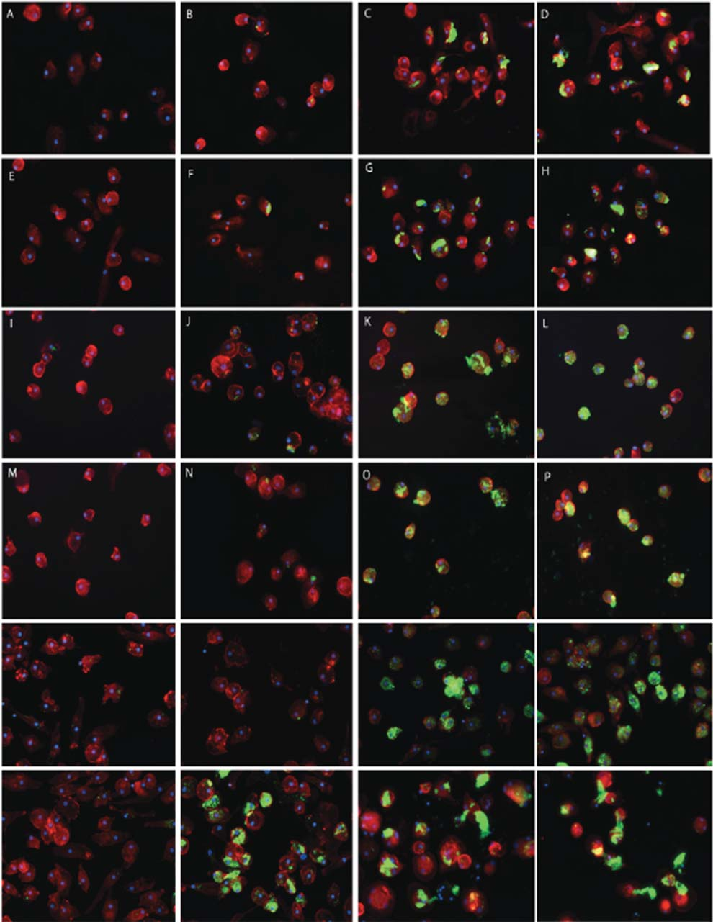
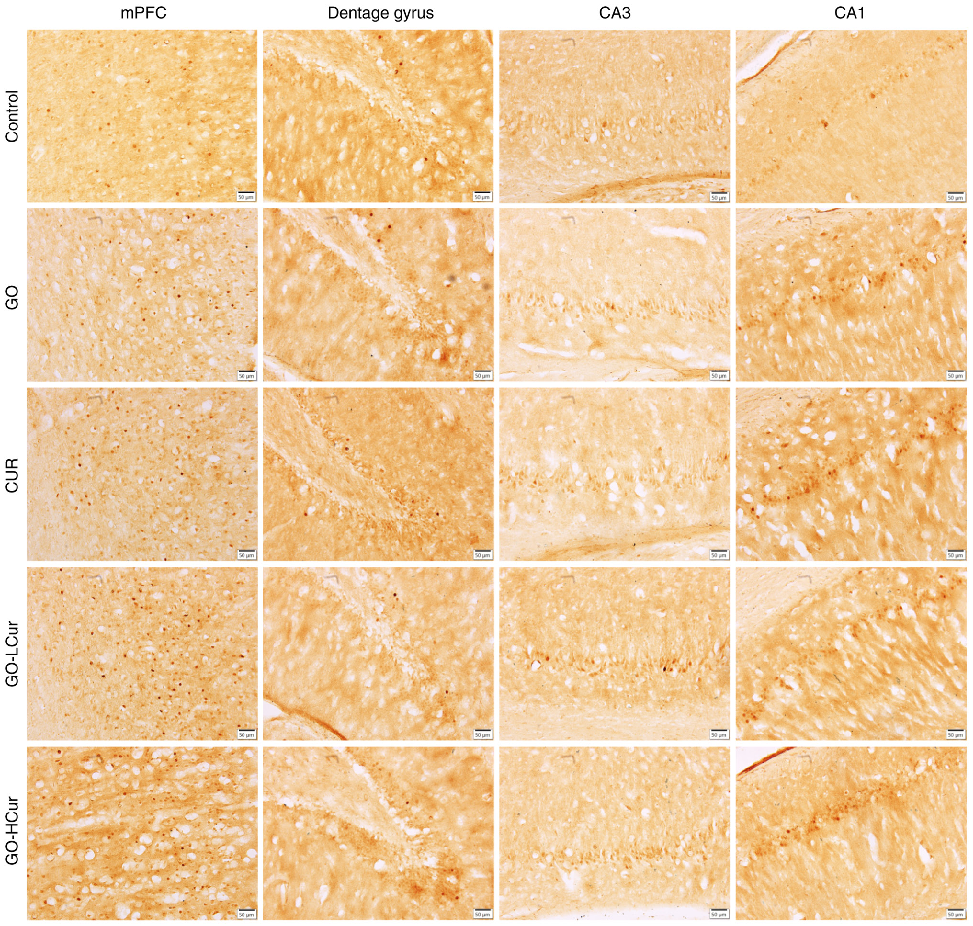
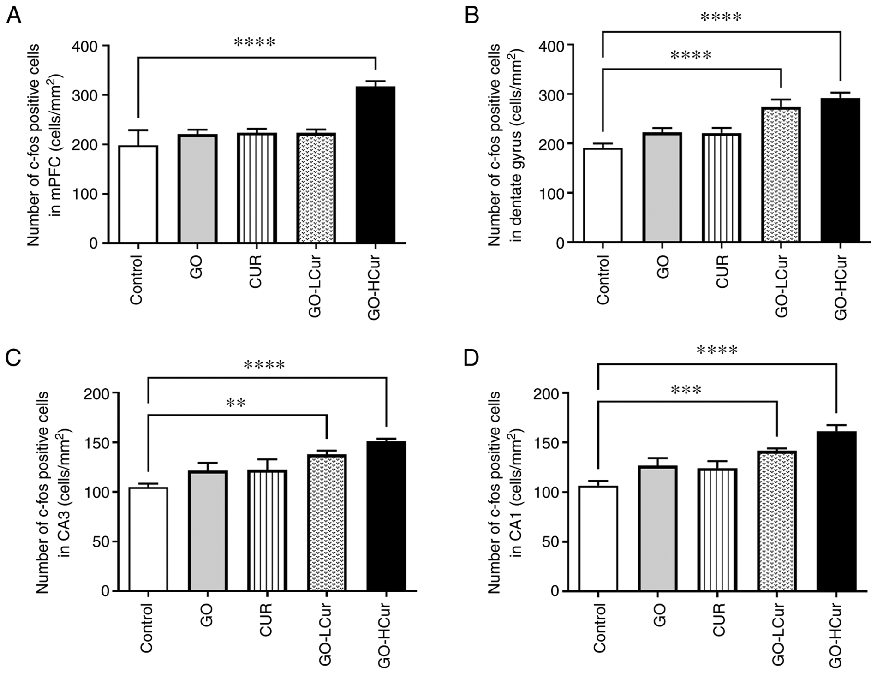
Figure 1. Expression of c‑Fos was evaluated by immunohistochemical staining. Middle‑aged control rats showed lower c‑Fos expression than the adult controls in the mPFC, dentate gyrus, CA3, and CA1 areas. …
Effects of curcumin and γ-oryzanol solid dispersion on the brain of middle-aged …
Effects of curcumin and γ-oryzanol solid dispersion on the brain of middle-aged …
Effects of curcumin and γ-oryzanol solid dispersion on the brain of middle-aged …
Effects of curcumin and γ-oryzanol solid dispersion on the brain of middle-aged …
Effects of curcumin and γ-oryzanol solid dispersion on the brain of middle-aged …
Effects of curcumin and γ-oryzanol solid dispersion on the brain of middle-aged …
Effects of curcumin and γ-oryzanol solid dispersion on the brain of middle-aged …
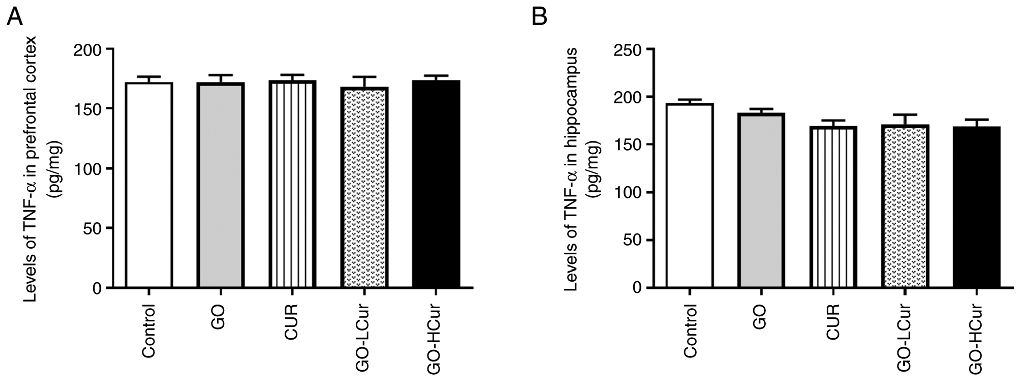
Figure 8. Effect of GOSD and CURSD on levels of TNF‑α in (A) the prefrontal cortex, and (B) hippocampus areas. Data are presented as the mean ± SEM. TNF‑α, tumor …
Effects of curcumin and γ-oryzanol solid dispersion on the brain of middle-aged …
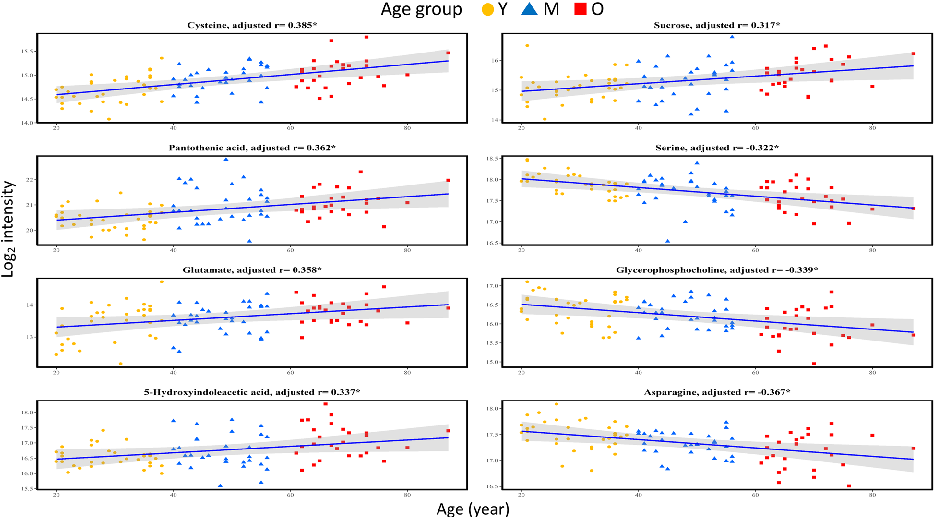
Scatter plots of individual metabolite abundance versus age reveal significant correlations for specific compounds, suggesting continuous metabolic drift across the lifespan.
Exploring the aging process of cognitively healthy adults by analyzing cerebrospinal fluid …
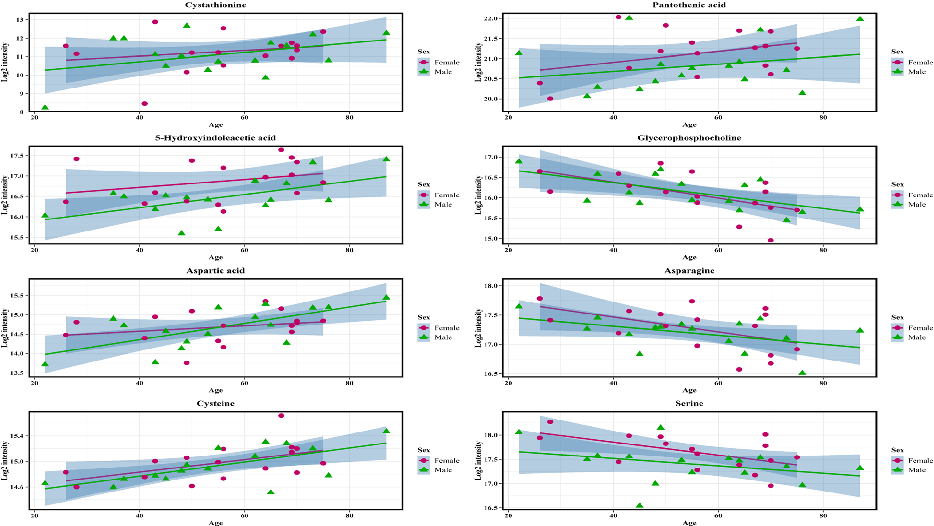
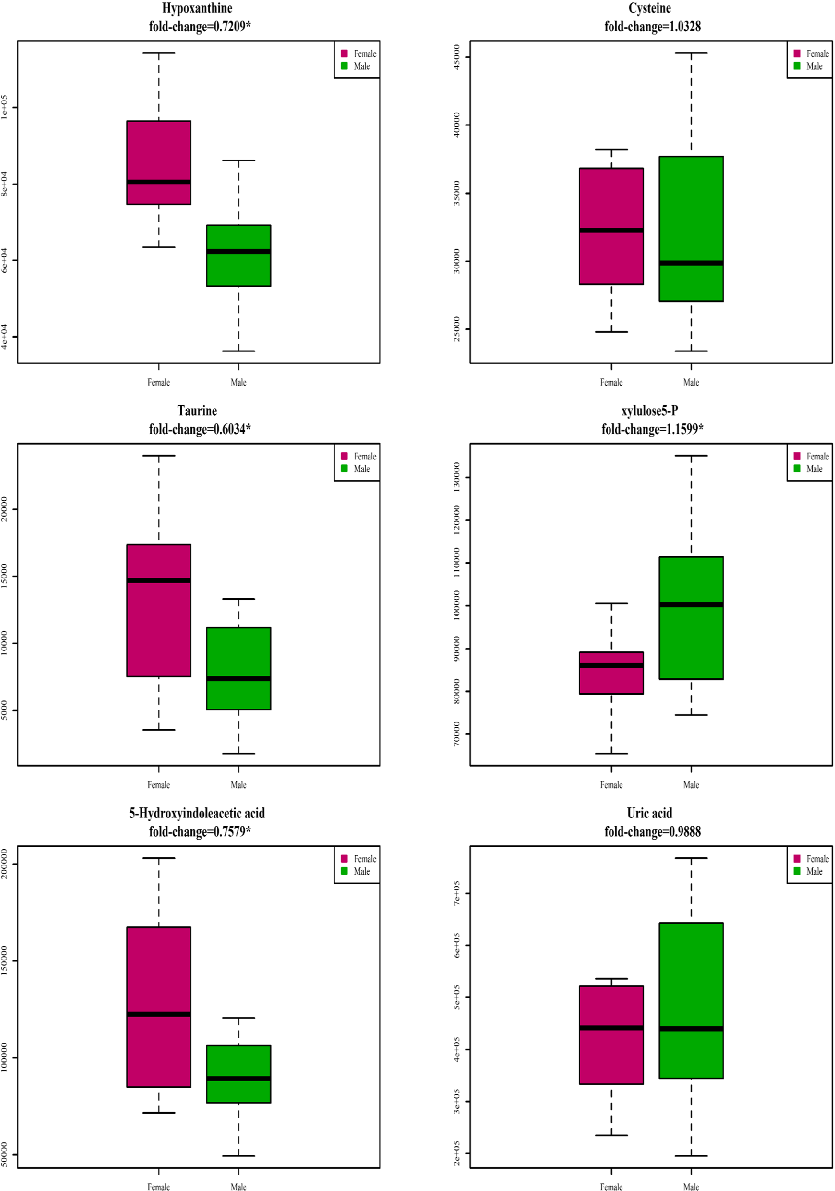
Sex-stratified metabolite-age correlation analysis in cerebrospinal fluid shows both shared and sex-specific metabolic aging patterns.
Exploring the aging process of cognitively healthy adults by analyzing cerebrospinal fluid …
Pathway enrichment analysis of age-associated CSF metabolites identifies disrupted metabolic pathways, including amino acid and lipid metabolism, during brain aging.
Exploring the aging process of cognitively healthy adults by analyzing cerebrospinal fluid …
Receiver operating characteristic curves evaluate the discriminative ability of selected CSF metabolites to distinguish older from younger cognitively healthy adults.
Exploring the aging process of cognitively healthy adults by analyzing cerebrospinal fluid …
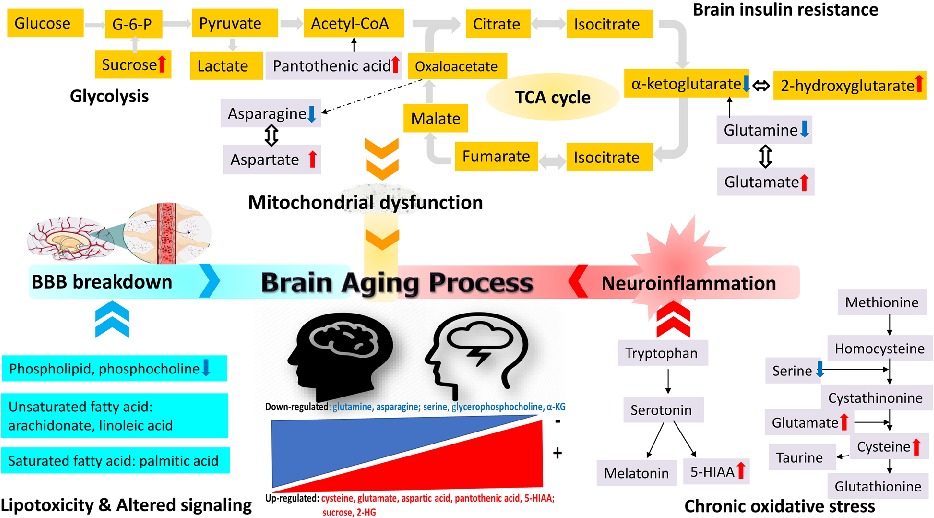
A schematic diagram summarizes the profiled CSF metabolite changes during brain aging, linking age-related metabolic shifts to neurodegeneration risk pathways.
Exploring the aging process of cognitively healthy adults by analyzing cerebrospinal fluid …
Metabolomics profiling identifies significantly altered metabolites in precocious versus normal crabs, with enrichment in lipid and amino acid metabolic pathways.
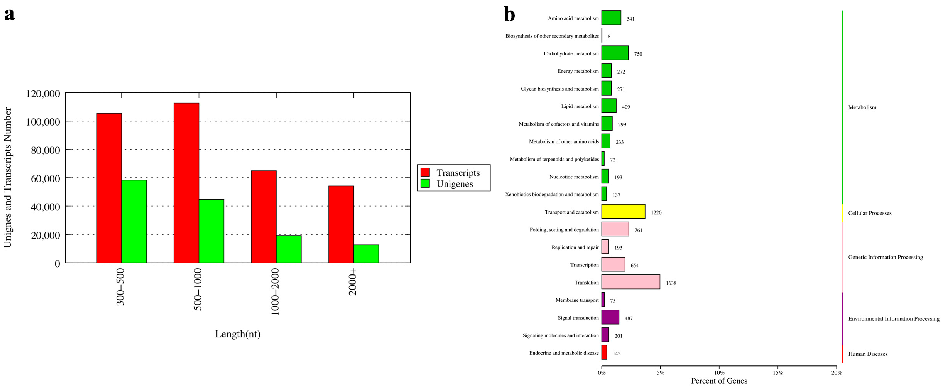
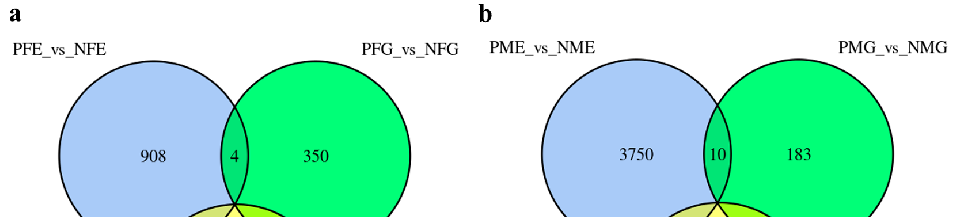
Integrated Analysis of Transcriptomics and Metabolomics Unveil the Novel Insight of One-Year-Old …
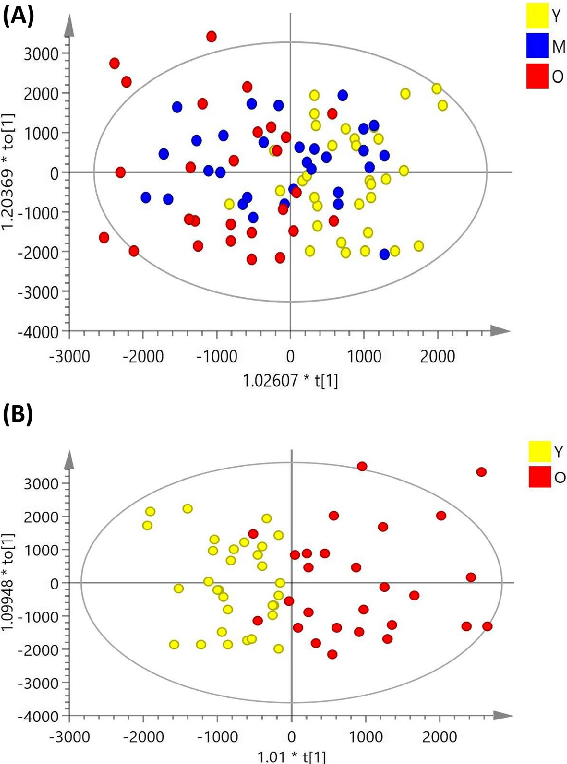
Principal component analysis of metabolomic data separates precocious from normally developing crabs based on their distinct metabolic profiles.
Integrated Analysis of Transcriptomics and Metabolomics Unveil the Novel Insight of One-Year-Old …
Volcano plot visualization highlights metabolites significantly enriched or depleted in precocious crabs compared to age-matched controls.
Integrated Analysis of Transcriptomics and Metabolomics Unveil the Novel Insight of One-Year-Old …
16ページ中9ページ目