अनुसंधान प्रक्रिया
368 सहकर्मी-समीक्षित शोध से आंकड़े
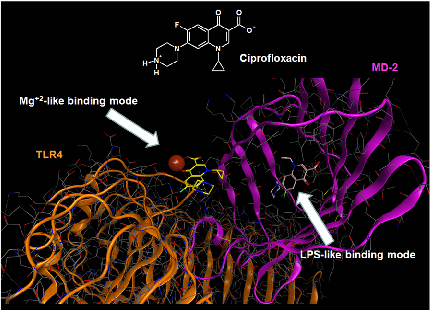
Molecular docking analysis reveals two alternative binding conformations of ciprofloxacin within the TLR4-MD-2 complex binding pocket, suggesting direct physical interaction with the innate immune receptor.
Ciprofloxacin and levofloxacin attenuate microglia inflammatory response via TLR4/NF-kB pathway.
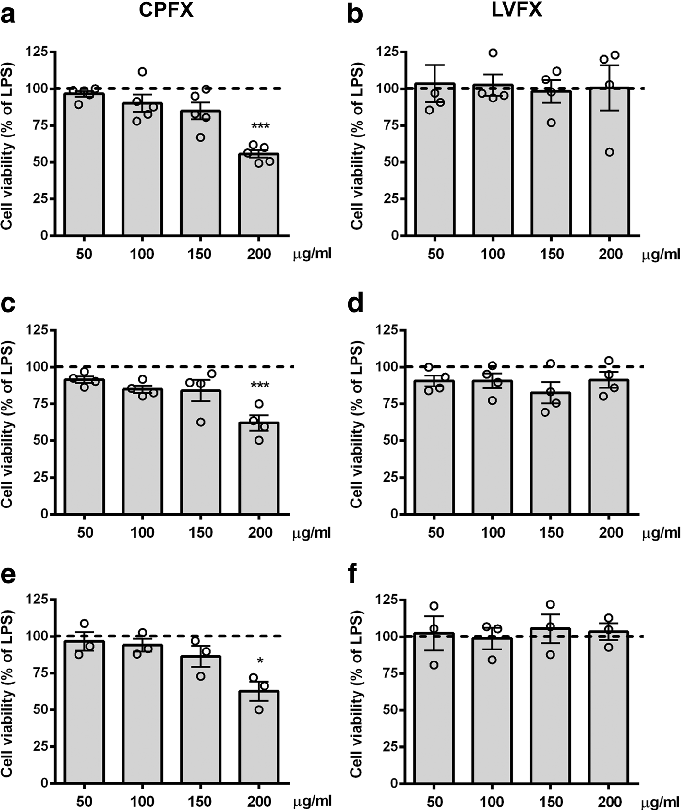
Cell viability assays demonstrate that ciprofloxacin and levofloxacin at the tested concentrations do not significantly reduce microglial survival, confirming that anti-inflammatory effects are not due to cytotoxicity.
Ciprofloxacin and levofloxacin attenuate microglia inflammatory response via TLR4/NF-kB pathway.
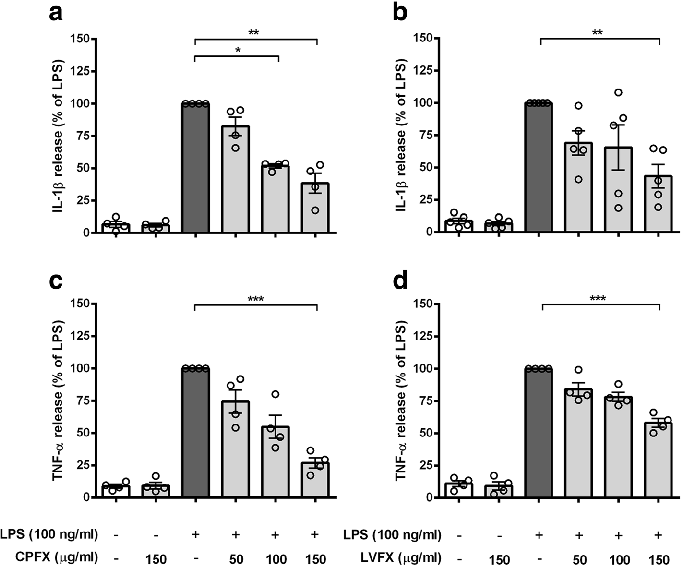
Cytokine release profiles from LPS-stimulated cortical microglia reveal dose-dependent reductions in TNF-alpha and IL-6 following fluoroquinolone treatment.
Ciprofloxacin and levofloxacin attenuate microglia inflammatory response via TLR4/NF-kB pathway.
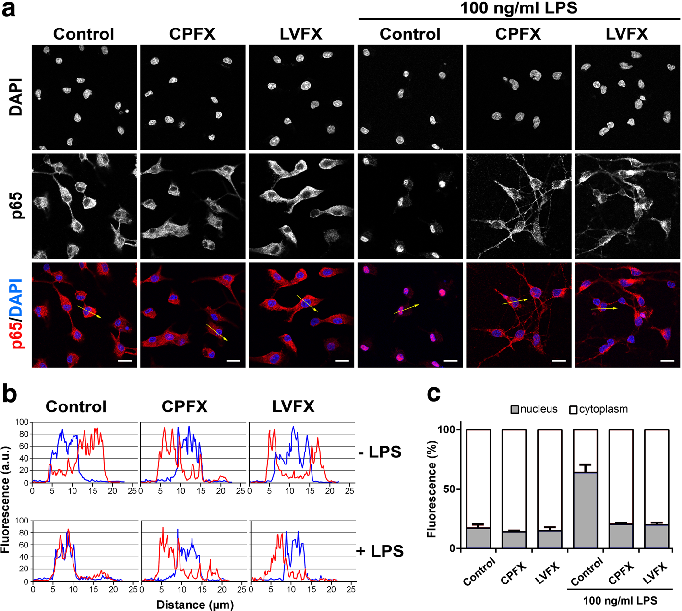
NF-kB nuclear translocation in LPS-stimulated microglia is attenuated by both ciprofloxacin and levofloxacin, as shown by immunofluorescence or reporter gene assays.
Ciprofloxacin and levofloxacin attenuate microglia inflammatory response via TLR4/NF-kB pathway.
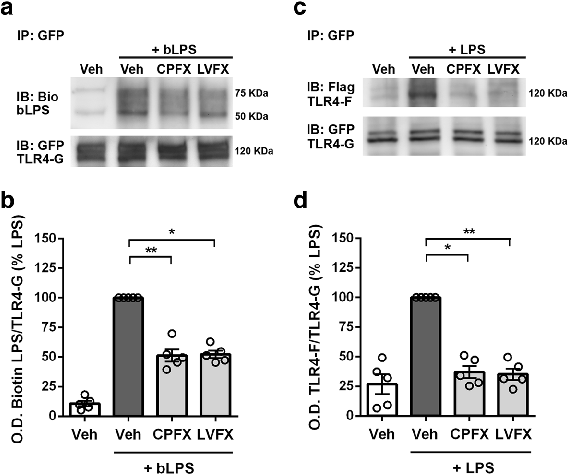
LPS binding and TLR4 dimerization assays in Ba/F3 cells demonstrate that fluoroquinolones interfere with the initial receptor activation step of innate immune signaling.
Ciprofloxacin and levofloxacin attenuate microglia inflammatory response via TLR4/NF-kB pathway.
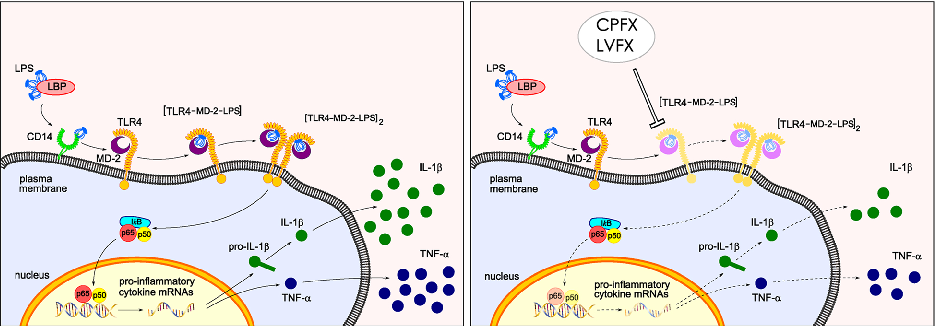
Proposed mechanistic model depicts how ciprofloxacin and levofloxacin target the TLR4-MD-2 complex to block LPS-induced downstream signaling cascades and cytokine production.
Ciprofloxacin and levofloxacin attenuate microglia inflammatory response via TLR4/NF-kB pathway.
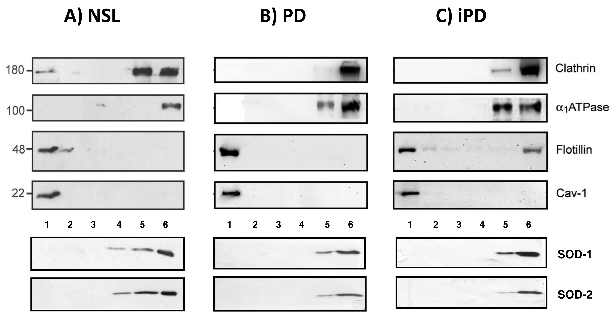
Western blot analyses of protein markers across density gradient fractions from control, Parkinson's disease, and incidental PD brain cortices reveal altered lipid raft protein distribution.
Severe alterations in lipid composition of frontal cortex lipid rafts from Parkinson's …
Lipid composition analyses comparing raft and non-raft fractions between control and Parkinson's disease frontal cortex samples show significant alterations in cholesterol and sphingolipid content.
Severe alterations in lipid composition of frontal cortex lipid rafts from Parkinson's …
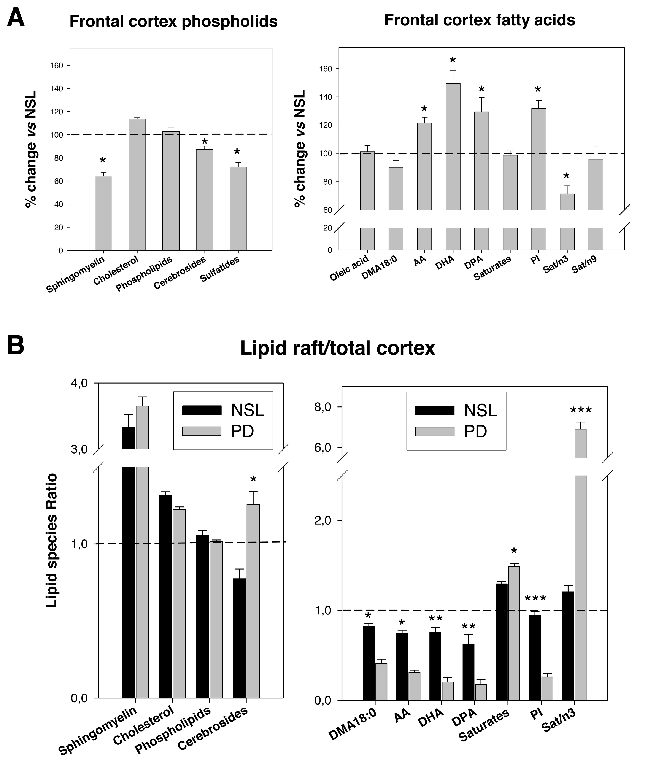
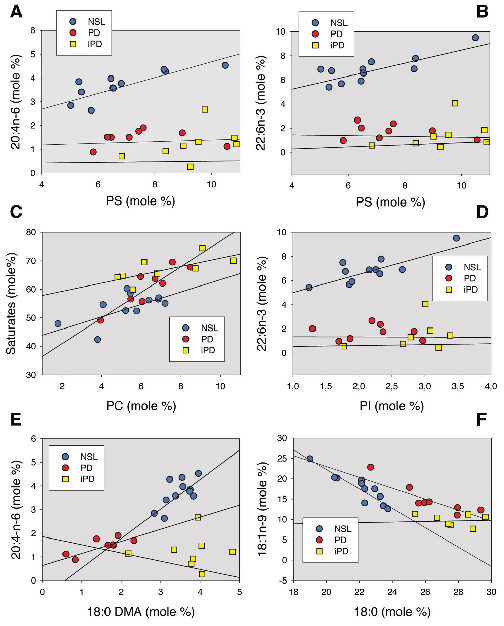
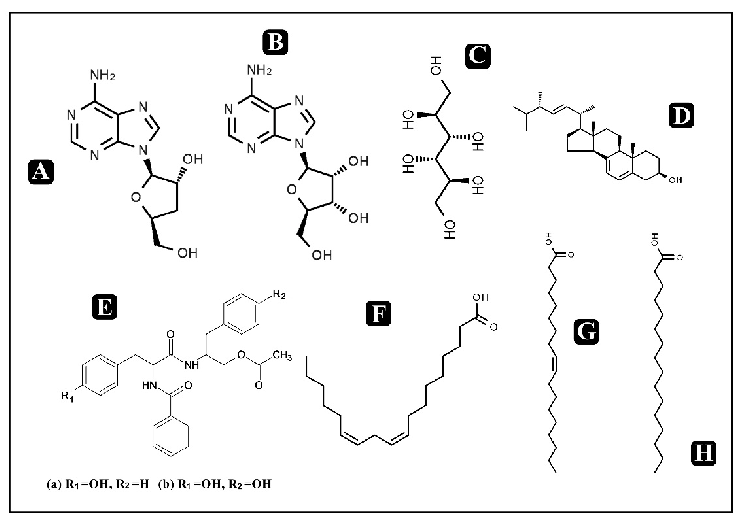
Comparative analyses of main lipid classes and fatty acid content between control and PD frontal cortex gray matter reveal disease-associated shifts in polyunsaturated fatty acid profiles and raft lipid indices.
Severe alterations in lipid composition of frontal cortex lipid rafts from Parkinson's …
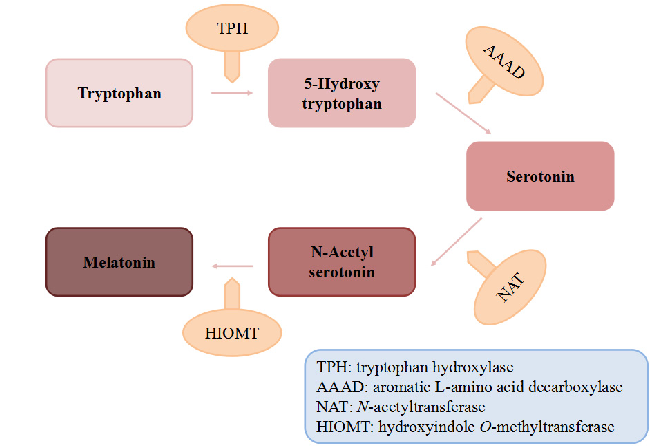
Biosynthetic pathway of melatonin from tryptophan is displayed, showing the sequential enzymatic steps through serotonin N-acetyltransferase and hydroxyindole-O-methyltransferase.
Dietary Sources and Bioactivities of Melatonin.
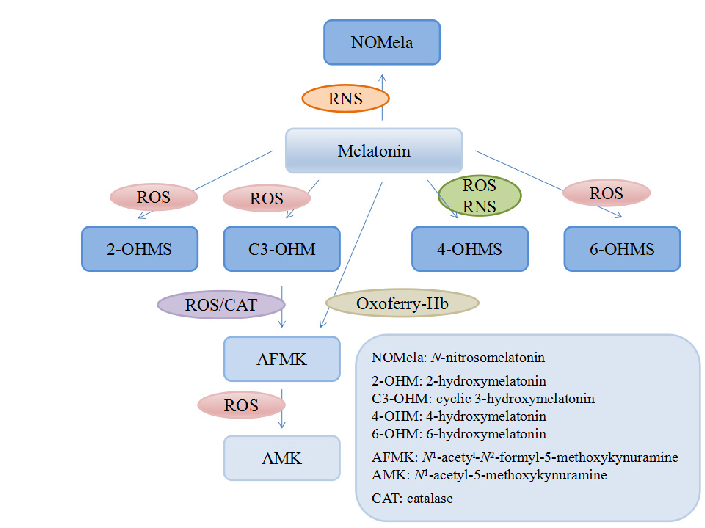
Melatonin and its metabolites including 6-hydroxymelatonin, AFMK, and AMK are structurally depicted, illustrating the biotransformation cascade.
Dietary Sources and Bioactivities of Melatonin.
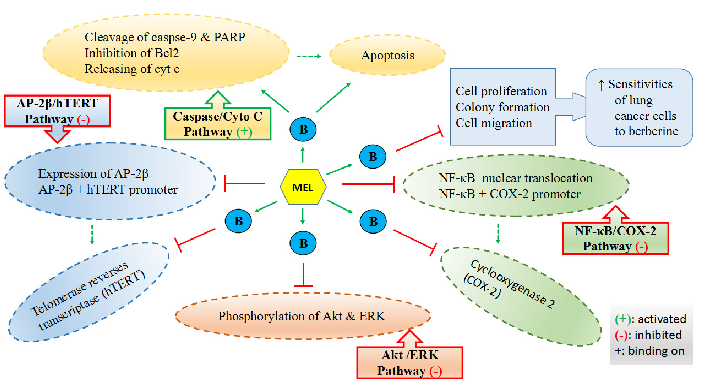
Mechanisms by which melatonin enhances lung cancer cell sensitivity to berberine are diagrammed, showing synergistic effects on apoptotic and autophagic pathways.
Dietary Sources and Bioactivities of Melatonin.
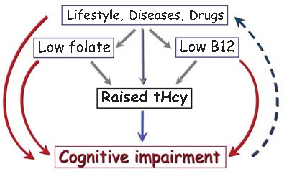
Brain imaging studies demonstrate that elevated homocysteine is associated with accelerated rates of brain atrophy, particularly in medial temporal lobe structures critical for memory. B-vitamin treatment appears to slow this atrophy in individuals with elevated baseline homocysteine.
Homocysteine and Dementia: An International Consensus Statement.
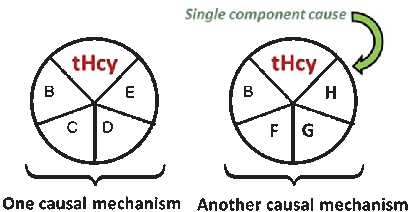
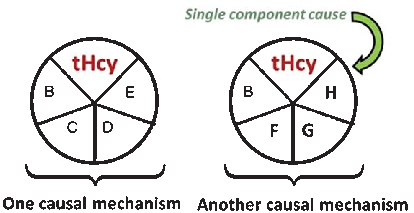
A causal model illustrates how elevated plasma homocysteine may contribute to dementia through multiple pathways, interacting with other risk factors such as age, hypercholesterolemia, and genetic predisposition. No single factor is sufficient alone; rather, combinations of component causes drive disease.
Homocysteine and Dementia: An International Consensus Statement.
Meta-analyses of cohort studies consistently indicate that elevated homocysteine is associated with approximately doubled risk of Alzheimer's disease. The strength of this association persists after adjustment for common confounders including age, sex, and education.
Homocysteine and Dementia: An International Consensus Statement.
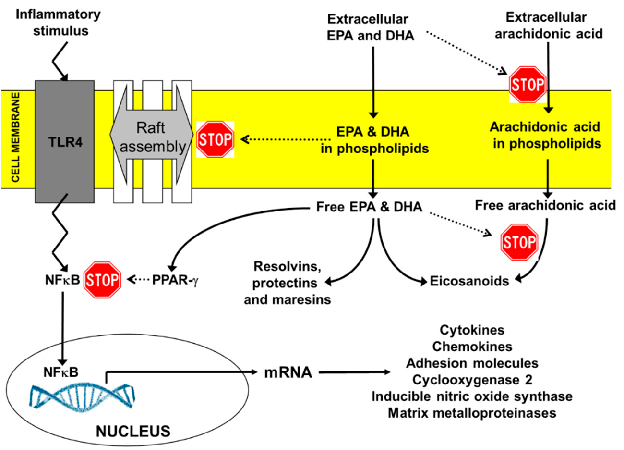
Key anti-inflammatory actions of EPA and DHA include suppression of NF-kB activation, reduction of pro-inflammatory eicosanoid production, inhibition of NLRP3 inflammasome activation, and promotion of regulatory T-cell differentiation through PPAR-gamma signaling.
Expert Opinion on Benefits of Long-Chain Omega-3 Fatty Acids (DHA and EPA) …
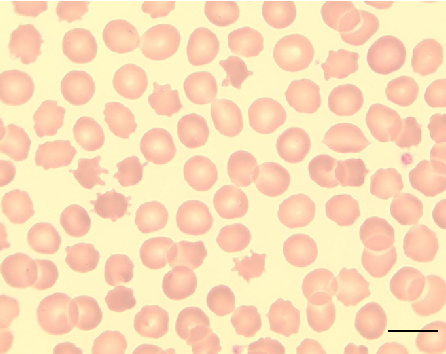
Peripheral blood smear from a patient with McLeod syndrome reveals acanthocytosis, characterized by irregularly spiculated red blood cells. May Gruenwald-Giemsa staining at 100x magnification (scale bar = 10 micrometers) highlights the distinctive thorny morphology of these erythrocytes.
Neuroacanthocytosis syndromes.
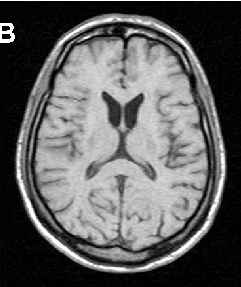
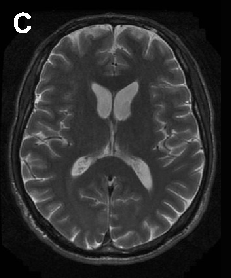
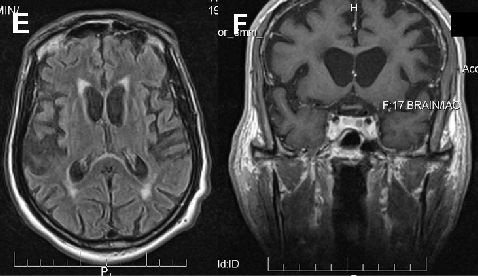
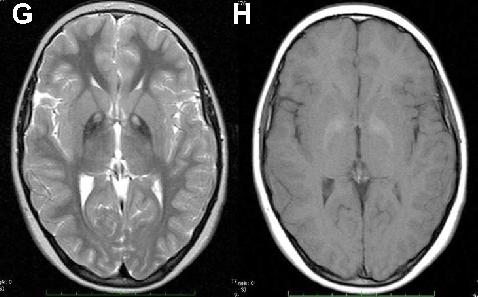
Brain imaging in neuroacanthocytosis typically reveals caudate nucleus atrophy and putaminal changes. This figure presents structural neuroimaging findings characteristic of advanced basal ganglia degeneration in NA patients.
Neuroacanthocytosis syndromes.
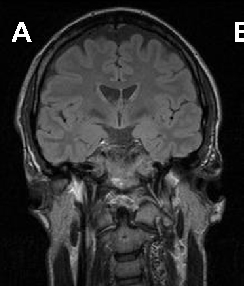
Brain imaging in neuroacanthocytosis typically reveals caudate nucleus atrophy and putaminal changes. This figure presents structural neuroimaging findings characteristic of advanced basal ganglia degeneration in NA patients.
Neuroacanthocytosis syndromes.
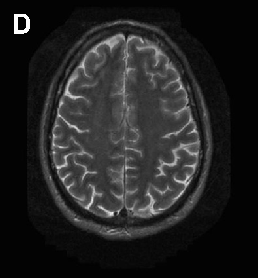
Brain imaging in neuroacanthocytosis typically reveals caudate nucleus atrophy and putaminal changes. This figure presents structural neuroimaging findings characteristic of advanced basal ganglia degeneration in NA patients.
Neuroacanthocytosis syndromes.
Neuroacanthocytosis encompasses multiple genetic subtypes with overlapping clinical features. This figure provides additional clinical, pathological, or molecular data supporting the differential diagnosis of these rare movement disorders.
Neuroacanthocytosis syndromes.
Neuroacanthocytosis encompasses multiple genetic subtypes with overlapping clinical features. This figure provides additional clinical, pathological, or molecular data supporting the differential diagnosis of these rare movement disorders.
Neuroacanthocytosis syndromes.
Neuroacanthocytosis encompasses multiple genetic subtypes with overlapping clinical features. This figure provides additional clinical, pathological, or molecular data supporting the differential diagnosis of these rare movement disorders.
Neuroacanthocytosis syndromes.
Neuroprotective and anti-fatigue properties of cordycepin have been demonstrated in preclinical models. This figure highlights cordycepin's potential benefits for neurological health and physical performance.
Cordycepin for Health and Wellbeing: A Potent Bioactive Metabolite of an Entomopathogenic …
पृष्ठ 1 / 16