Taurine चित्र
1 सहकर्मी-समीक्षित शोध से आंकड़े
सभी
Omega-3 Fatty Acids (DHA/EPA)
Bacopa monnieri
Citicoline
Phosphatidylserine
Ginkgo biloba
Curcumin
Creatine
Rhodiola rosea
L-Theanine
Panax Ginseng
Vitamin D
Vitamin B12
Folate
Resveratrol
Alpha-Lipoic Acid
Vitamin E
Green Tea Extract (EGCG)
Zinc
Uridine Monophosphate
Taurine
Lutein & Zeaxanthin
Melatonin
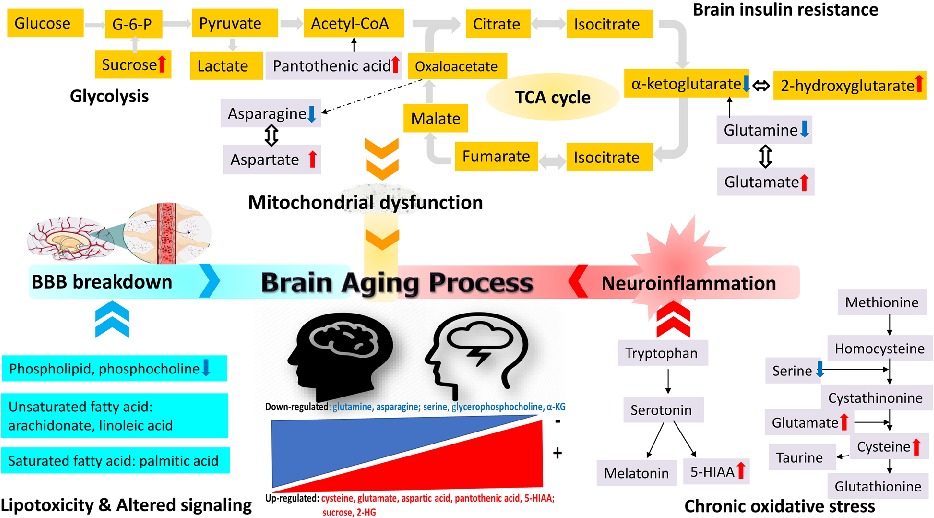
Figure 10
Diagram
A schematic diagram summarizes the profiled CSF metabolite changes during brain aging, linking age-related metabolic shifts to neurodegeneration risk pathways.
Exploring the aging process of cognitively healthy adults by analyzing cerebrospinal fluid …