Phosphatidylserine Gambar
10 gambar dari penelitian yang ditinjau oleh rekan sejawat
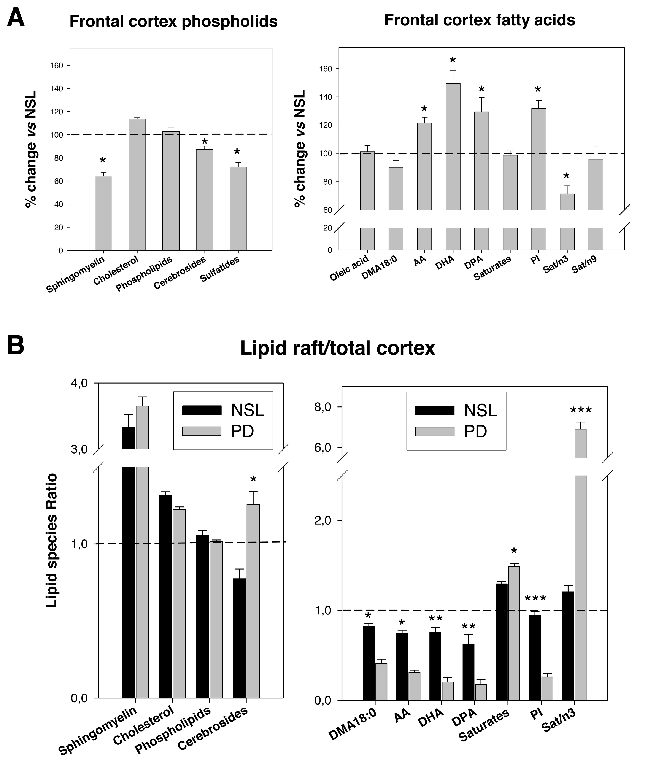
Lipid composition analyses comparing raft and non-raft fractions between control and Parkinson's disease frontal cortex samples show significant alterations in cholesterol and sphingolipid content.
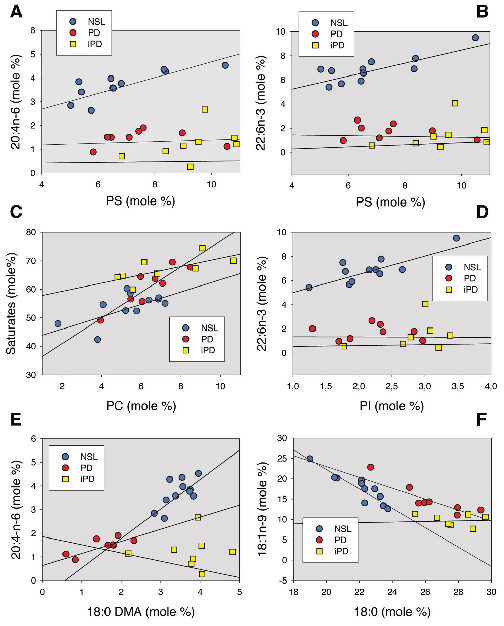
Severe alterations in lipid composition of frontal cortex lipid rafts from Parkinson's …
Comparative analyses of main lipid classes and fatty acid content between control and PD frontal cortex gray matter reveal disease-associated shifts in polyunsaturated fatty acid profiles and raft lipid indices.
Severe alterations in lipid composition of frontal cortex lipid rafts from Parkinson's …
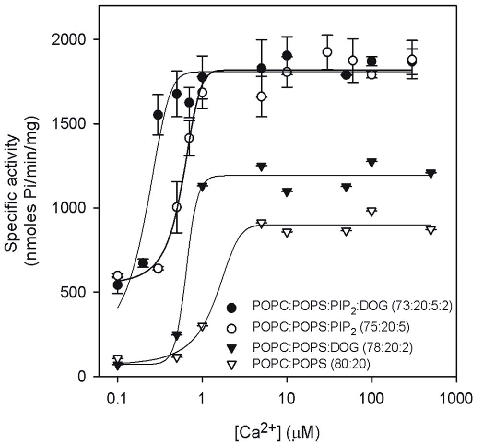
PKCα enzymatic activity is plotted as a function of calcium concentration, demonstrating how PIP2 reduces the calcium requirement for maximal kinase activation.
Phosphatidylinositol 4,5-bisphosphate decreases the concentration of Ca2+, phosphatidylserine and diacylglycerol required for …
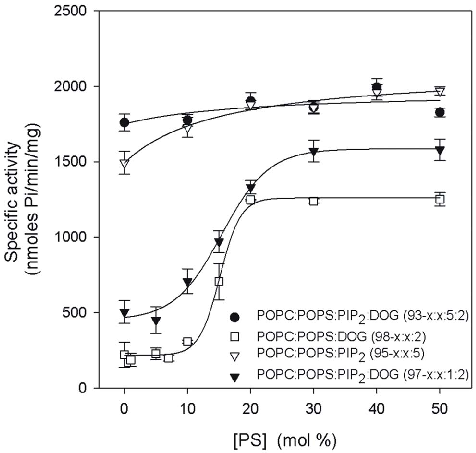
The dependence of PKCα activity on phosphatidylserine (POPS) concentration in lipid vesicles reveals that PIP2 lowers the threshold of phosphatidylserine needed for enzyme activation.
Phosphatidylinositol 4,5-bisphosphate decreases the concentration of Ca2+, phosphatidylserine and diacylglycerol required for …
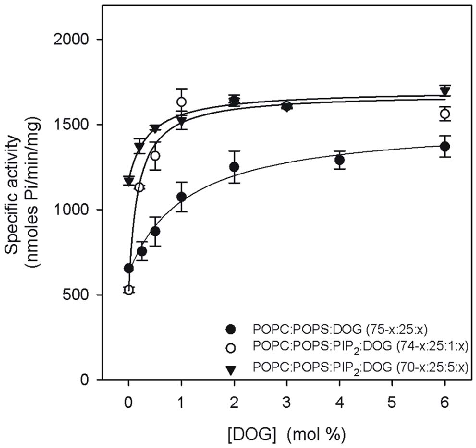
PKCα activity is shown as a function of diacylglycerol (DOG) molar percentage in lipid vesicles, illustrating the cofactor requirements for kinase activation.
Phosphatidylinositol 4,5-bisphosphate decreases the concentration of Ca2+, phosphatidylserine and diacylglycerol required for …
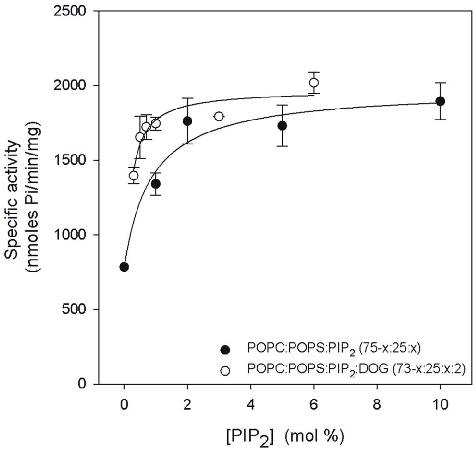
The relationship between PIP2 concentration and PKCα activity demonstrates that increasing PIP2 in lipid vesicles progressively enhances kinase activation efficiency.
Phosphatidylinositol 4,5-bisphosphate decreases the concentration of Ca2+, phosphatidylserine and diacylglycerol required for …
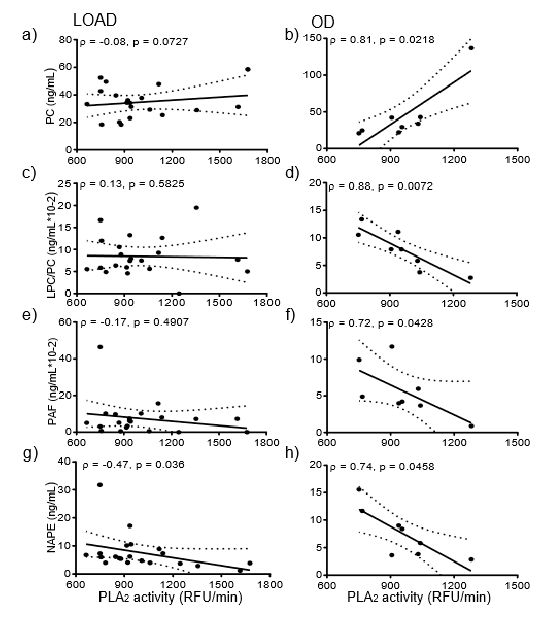
Correlation analysis between PLA2 activity and glycerophospholipid levels in Alzheimer's disease patients reveals no significant association, suggesting independent dysregulation pathways.
Lipid Metabolism in Late-Onset Alzheimer's Disease Differs from Patients Presenting with Other …
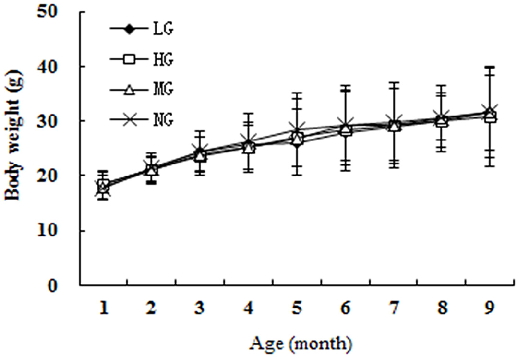
Daily food intake across groups confirms consistent consumption, with no significant differences between the low, high, and model groups during the study.
Protective Effects of Dietary Supplementation with a Combination of Nutrients in a …
Biochemical markers of oxidative stress and antioxidant capacity in brain tissue are compared across treatment groups, showing dose-dependent protective effects.
Protective Effects of Dietary Supplementation with a Combination of Nutrients in a …
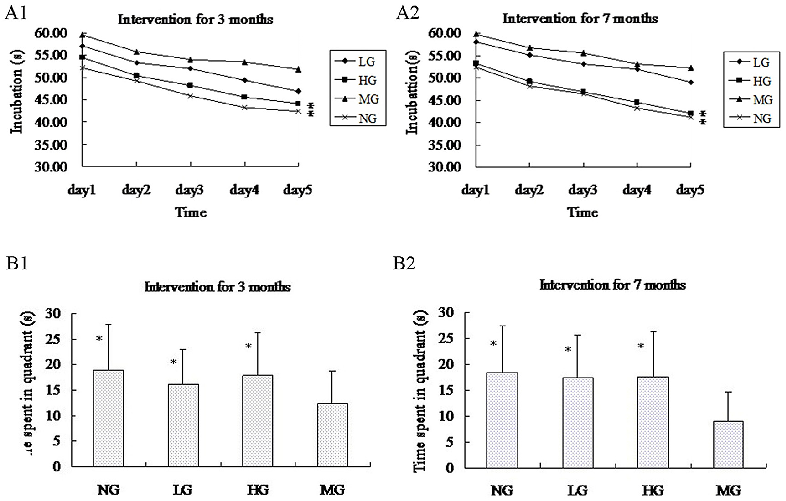
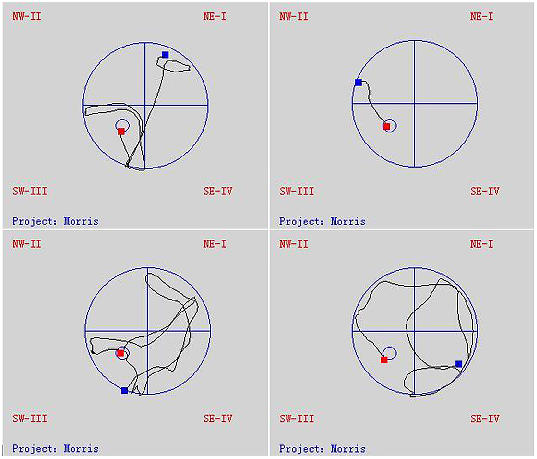
Morris water maze test results reveal that nutrient-supplemented APP-PSN mice demonstrate shorter escape latency and improved spatial memory compared to untreated transgenic controls.
Protective Effects of Dietary Supplementation with a Combination of Nutrients in a …