描述
Scatter plots of individual metabolite abundance versus age reveal significant correlations for specific compounds, suggesting continuous metabolic drift across the lifespan.
More Figures from This Paper
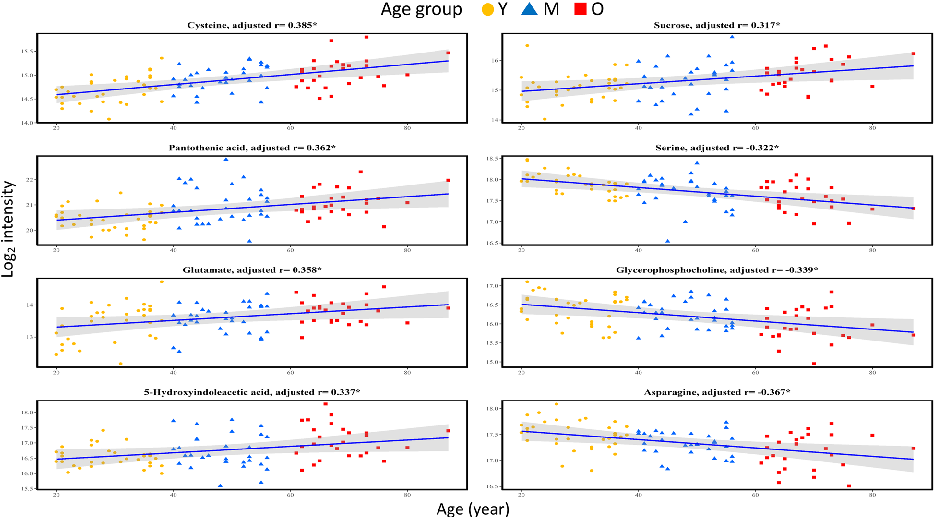
Figure 7
Sex-stratified metabolite-age correlation analysis in cerebrospinal fluid shows both shared and sex-specific metabolic aging patterns.
chart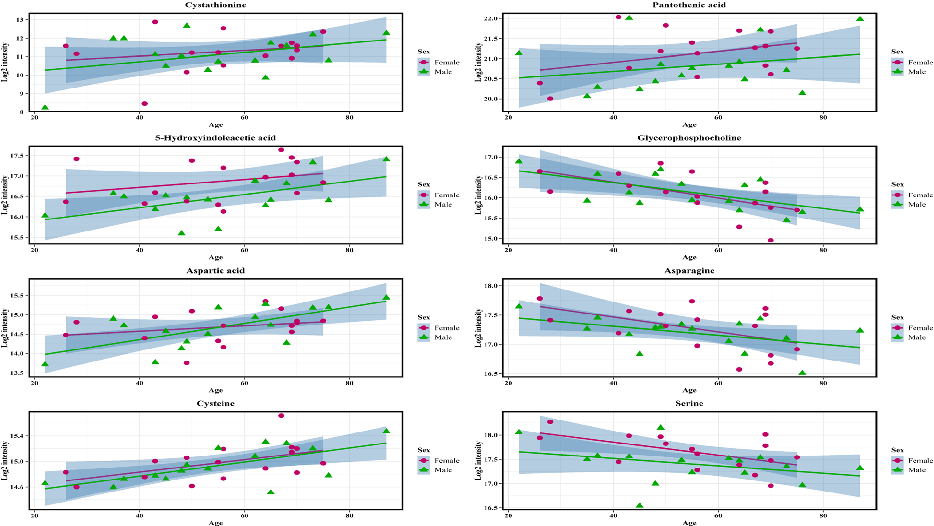
Figure 8
Pathway enrichment analysis of age-associated CSF metabolites identifies disrupted metabolic pathways, including amino acid and lipid metabolism, during brain aging.
chart
Figure 9
Receiver operating characteristic curves evaluate the discriminative ability of selected CSF metabolites to distinguish older from younger cognitively healthy adults.
chart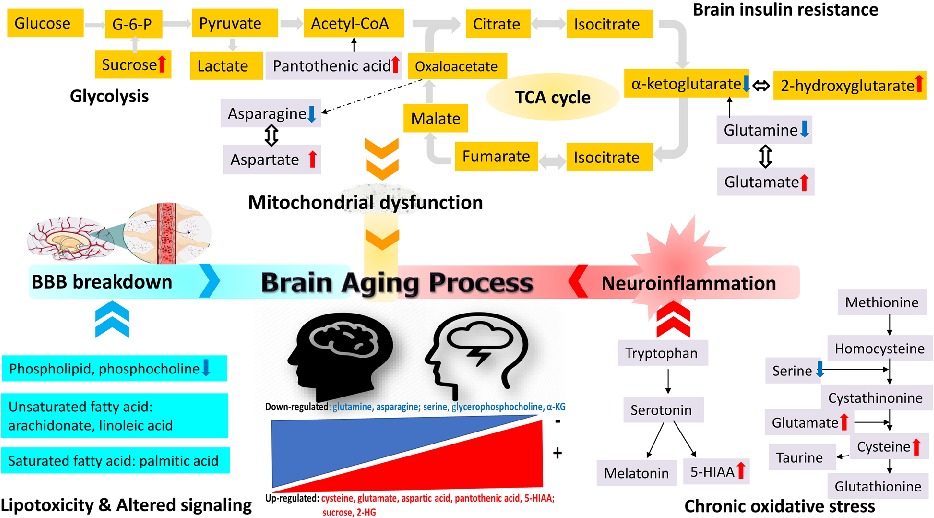
Figure 10
A schematic diagram summarizes the profiled CSF metabolite changes during brain aging, linking age-related metabolic shifts to neurodegeneration risk pathways.
diagramFigure 6
ChartSource Paper
Exploring the aging process of cognitively healthy adults by analyzing cerebrospinal fluid metabolomics using liquid chromatography-tandem mass spectrometry.Cite This Figure
 > Source: Fu-Chao Liu et al. "Exploring the aging process of cognitively healthy adults by analyzing cerebrosp." *BMC geriatrics*, 2023. PMID: [37020298](https://pubmed.ncbi.nlm.nih.gov/37020298/)
<figure>
  <img src="https://pdfs.citedhealth.com/figures/37020298/120.png" alt="Scatter plots of individual metabolite abundance versus age reveal significant correlations for specific compounds, suggesting continuous metabolic drift across the lifespan." />
  <figcaption>Figure 6. Scatter plots of individual metabolite abundance versus age reveal significant correlations for specific compounds, suggesting continuous metabolic drift across the lifespan.<br>  Source: Fu-Chao Liu et al. "Exploring the aging process of cognitively healthy adults by analyzing cerebrosp." <em>BMC geriatrics</em>, 2023. PMID: <a href="https://pubmed.ncbi.nlm.nih.gov/37020298/">37020298</a></figcaption>
</figure>